What TradiBook looks like inside: a look at every screen
A quick tour of TradiBook with real screenshots: dashboard, trades, calendar, analytics, funded accounts and finances.
Before signing up for a journal you want to know what you'll find when you log in. Here's the short tour: every TradiBook screen with a real screenshot and what it's for.
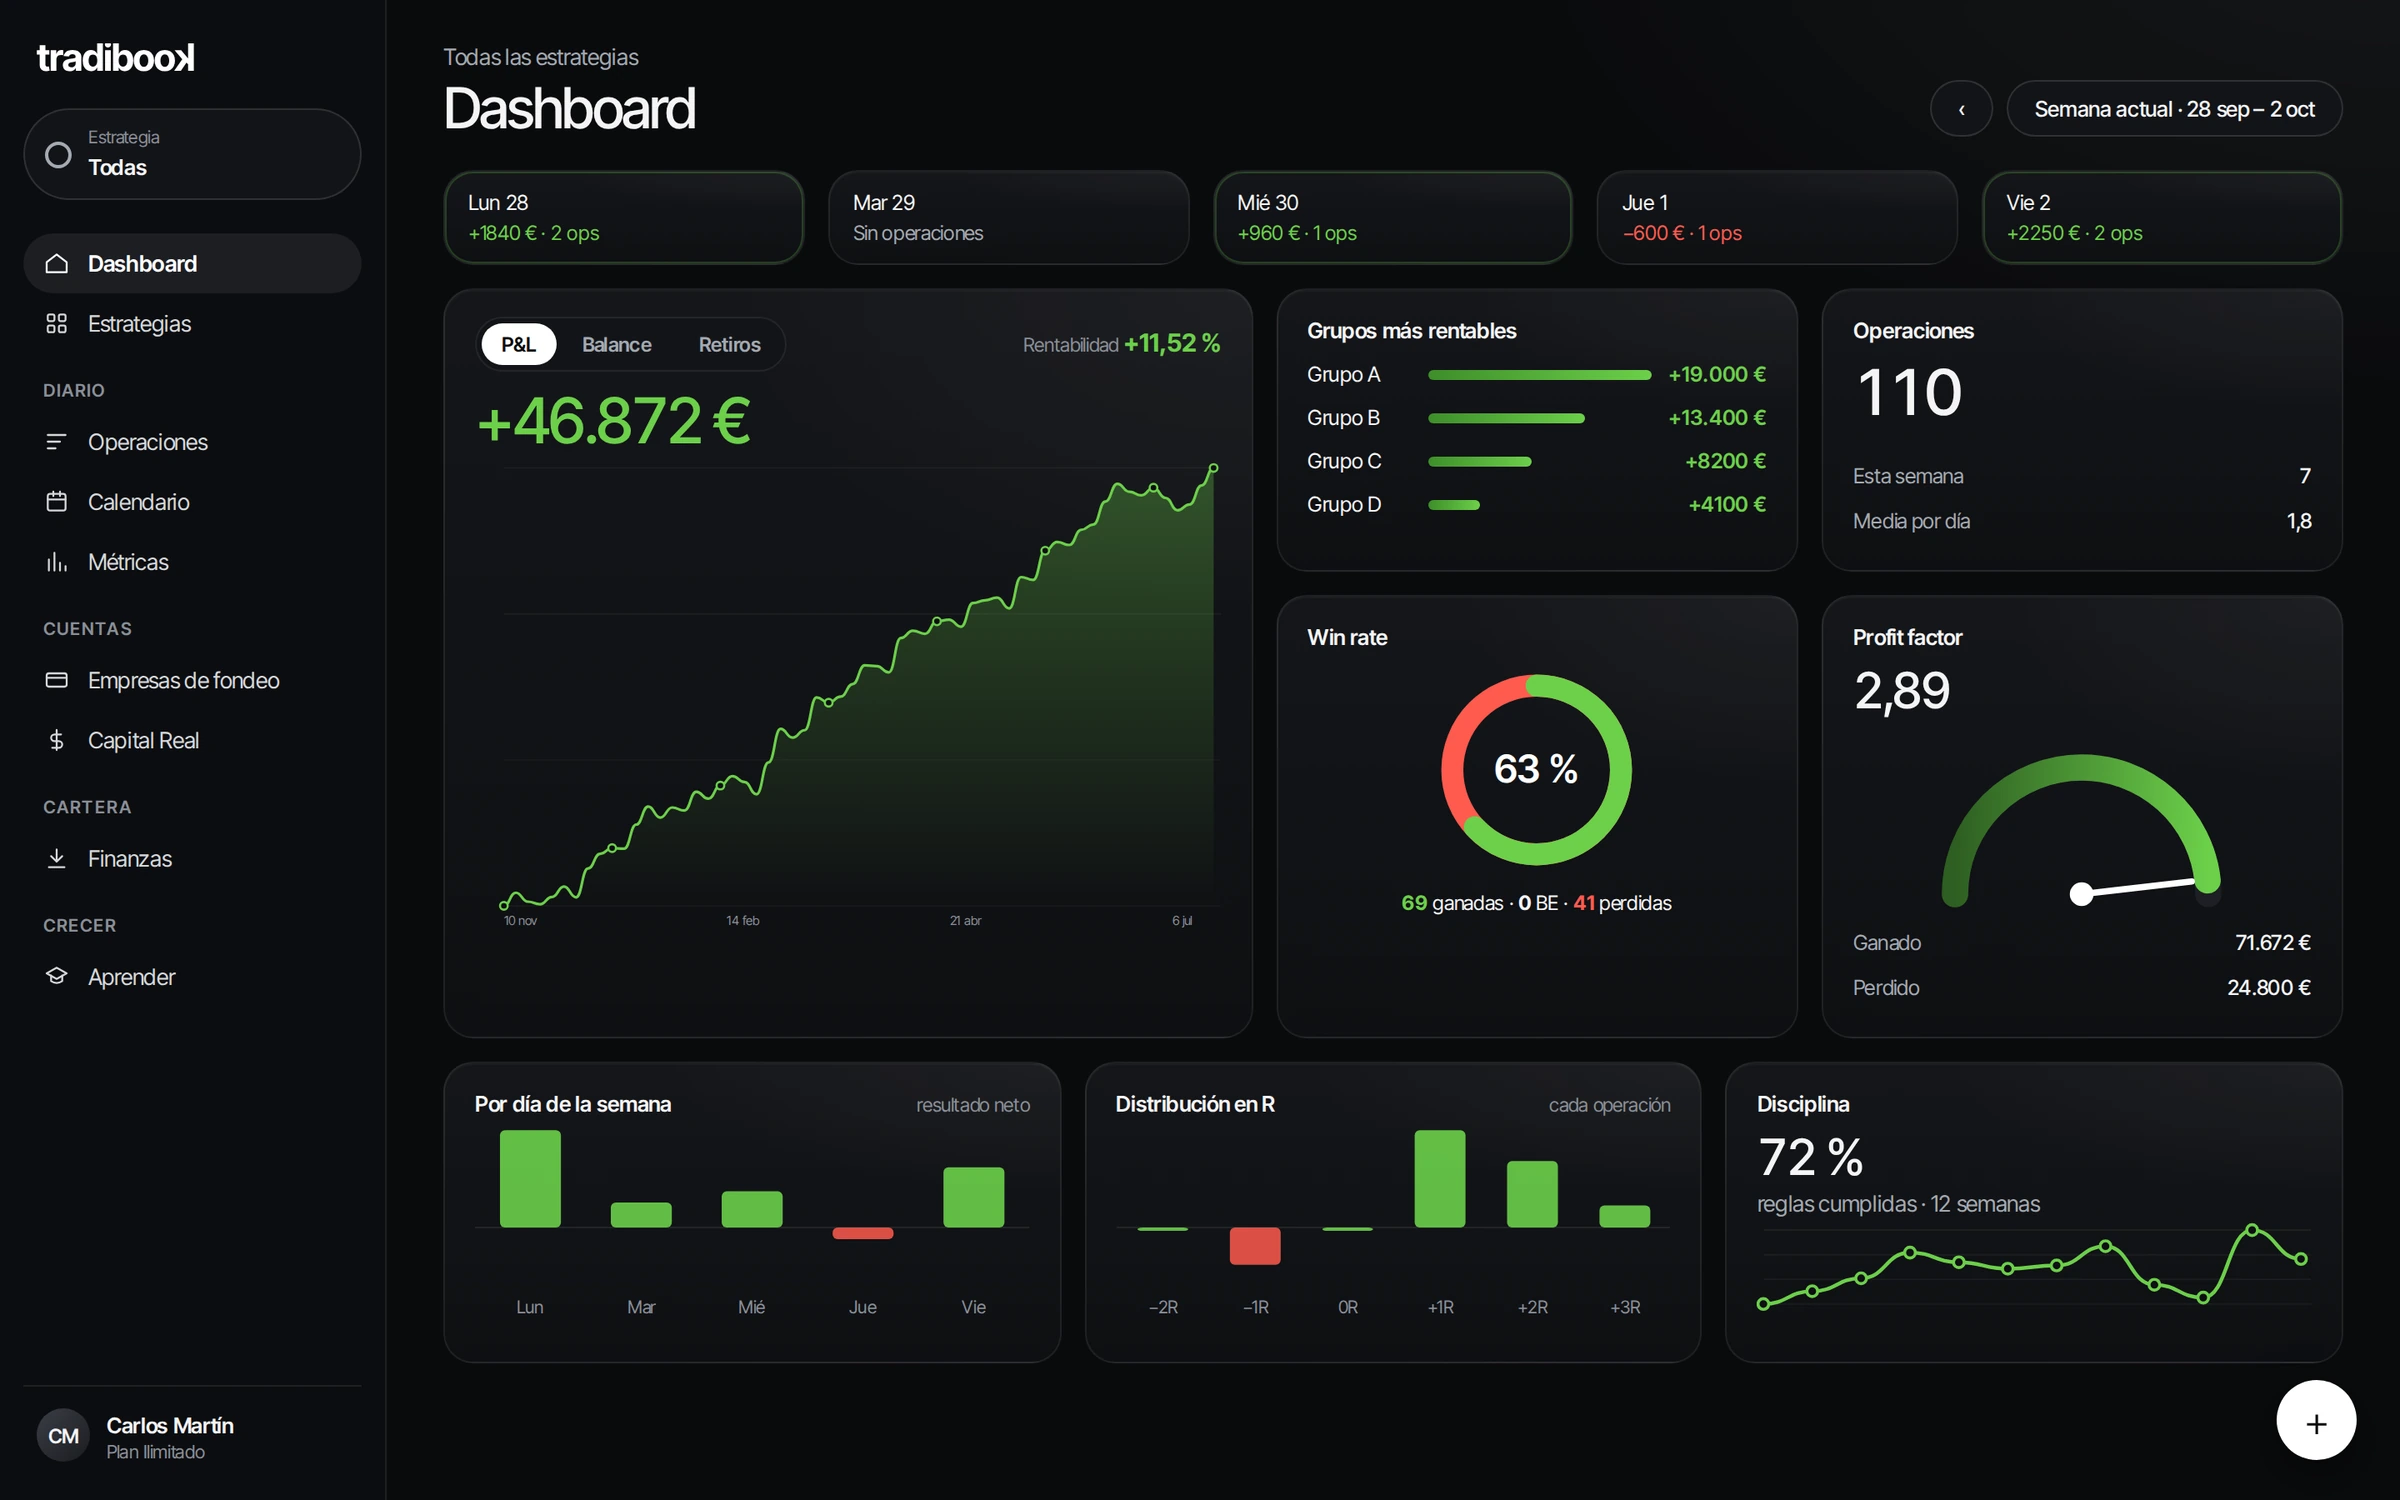
Dashboard: your trading on one screen
The first thing you see. Your cumulative result with the P&L curve, return, win rate, profit factor and which account groups are making you money. Below, how you perform each weekday, how your trades are spread in R and how well you follow your rules.
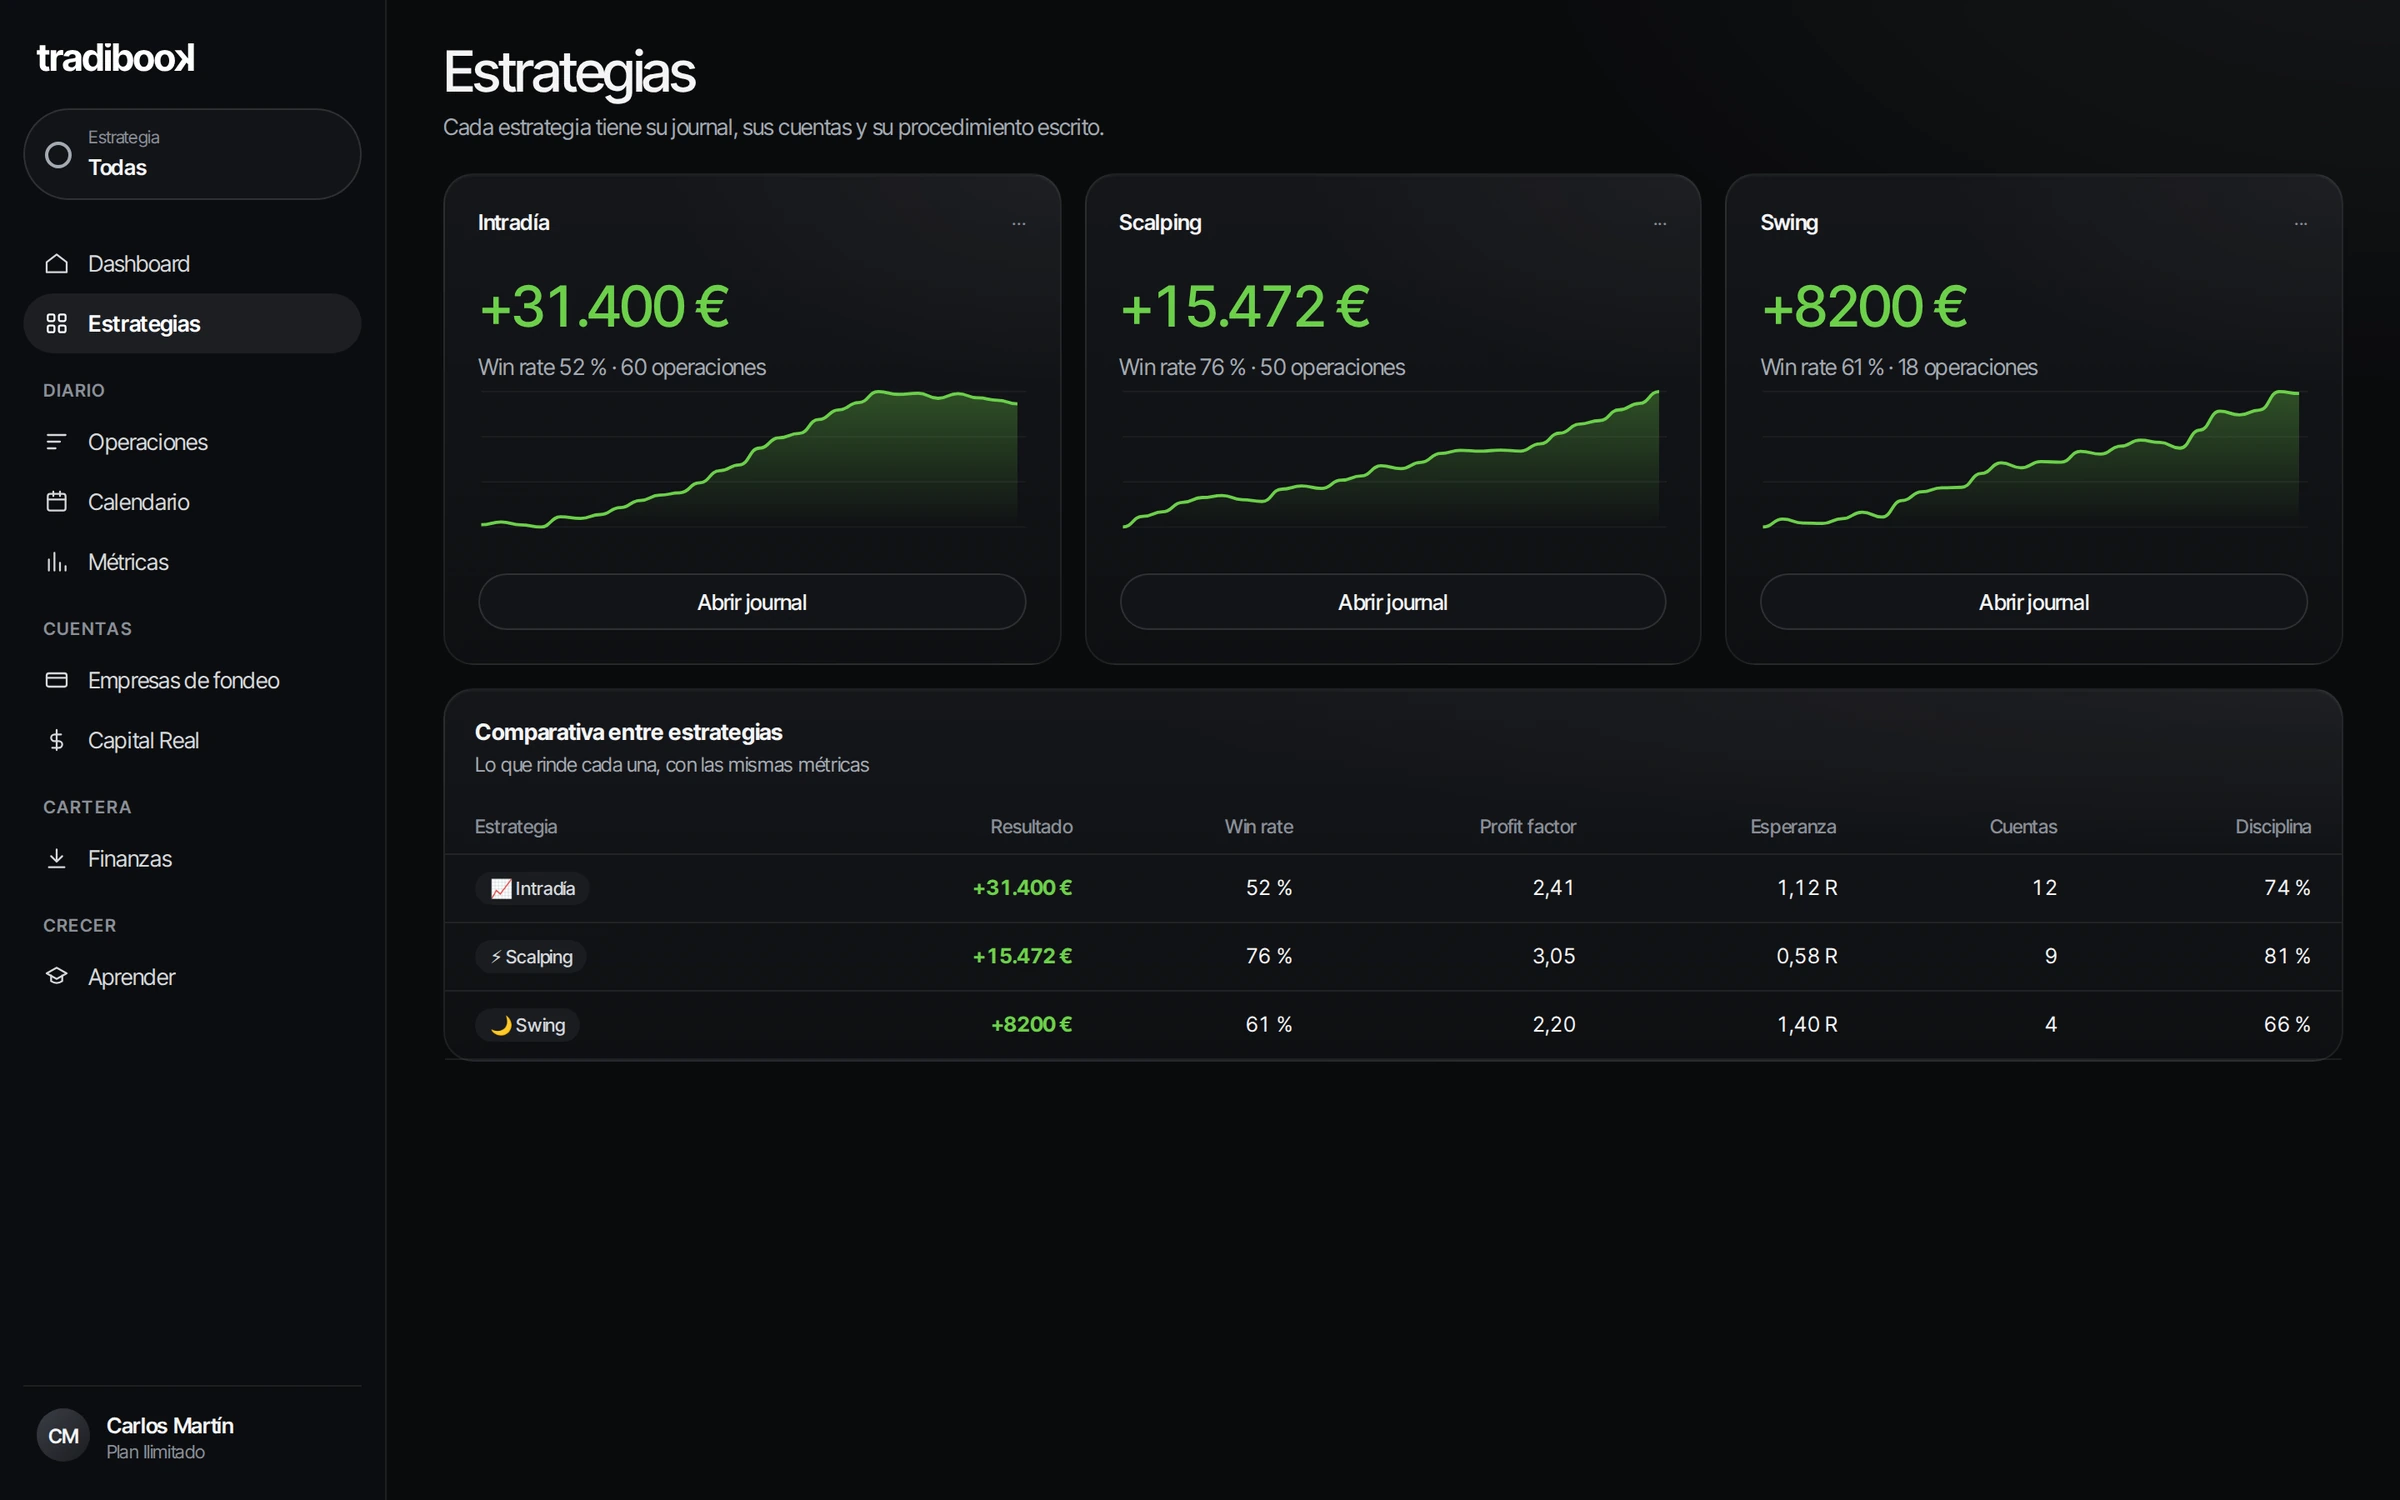
Strategies: each with its own journal
If you trade intraday and scalping, mixing them makes no sense. Each strategy has its own journal, accounts and written procedure, and from the sidebar you switch between them or see them all together.
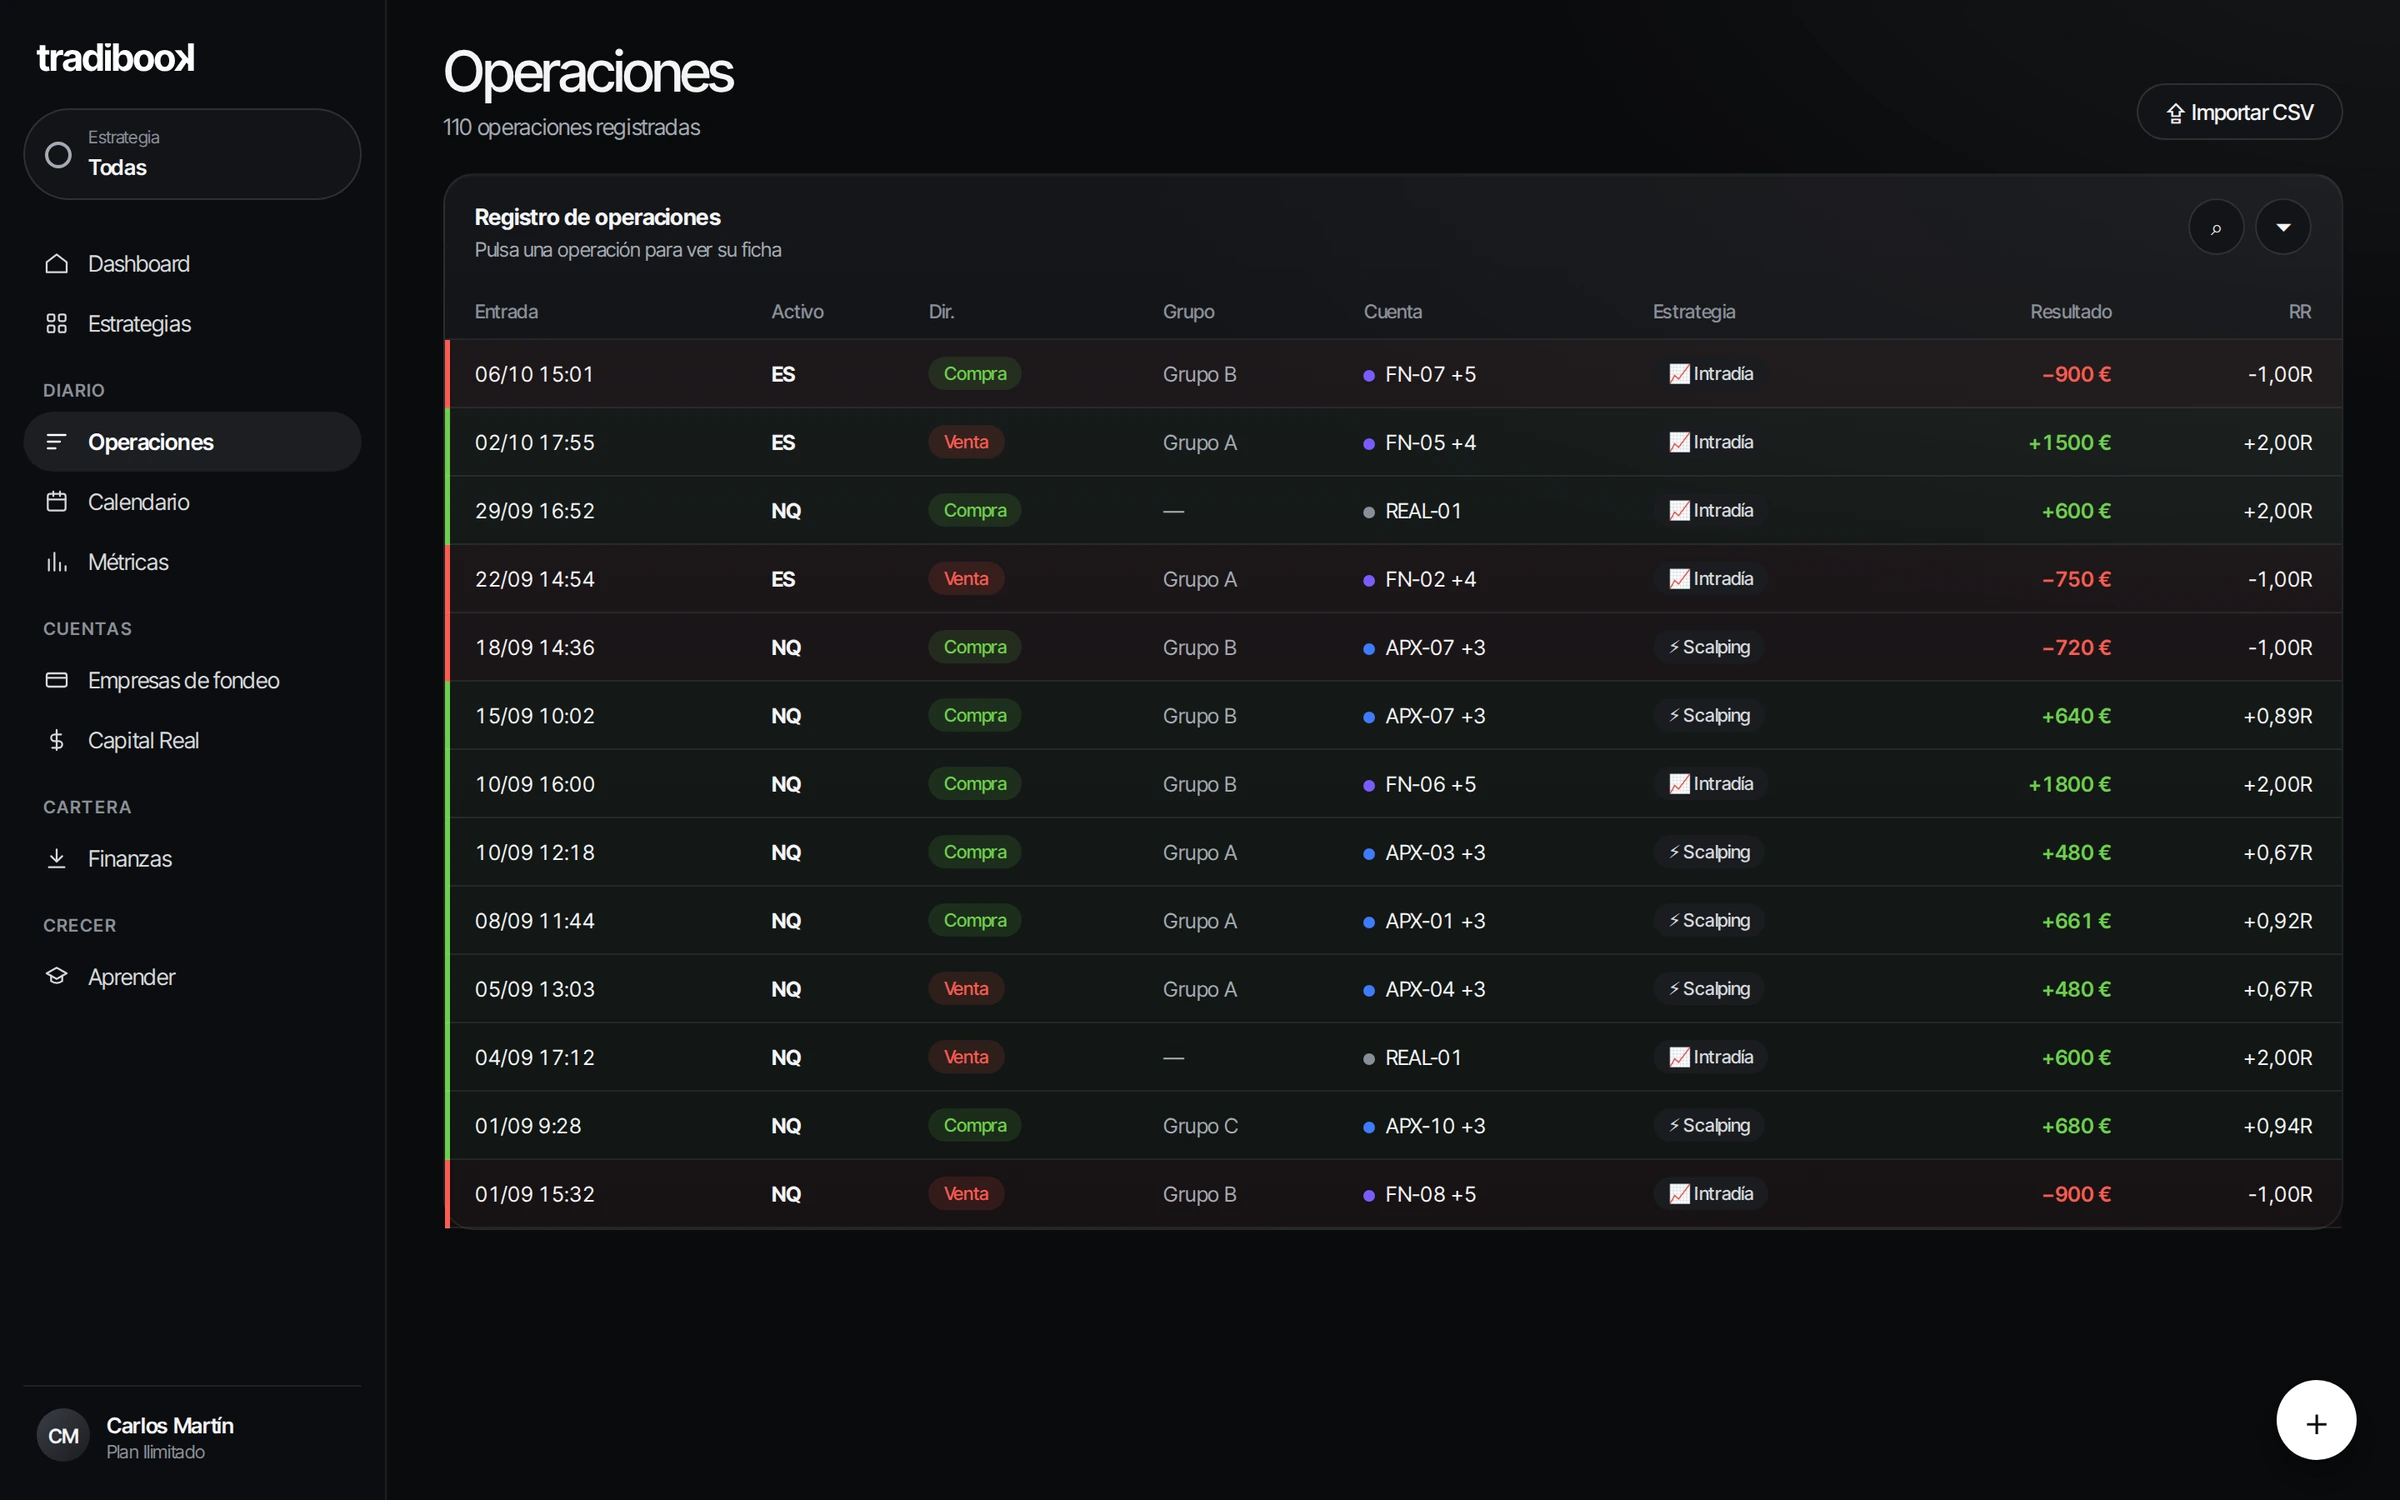
Trades: the complete log
All your trades in one table: symbol, side, group, account, strategy, result and R. You can search, filter and sort them, and import them from a CSV instead of entering them by hand.
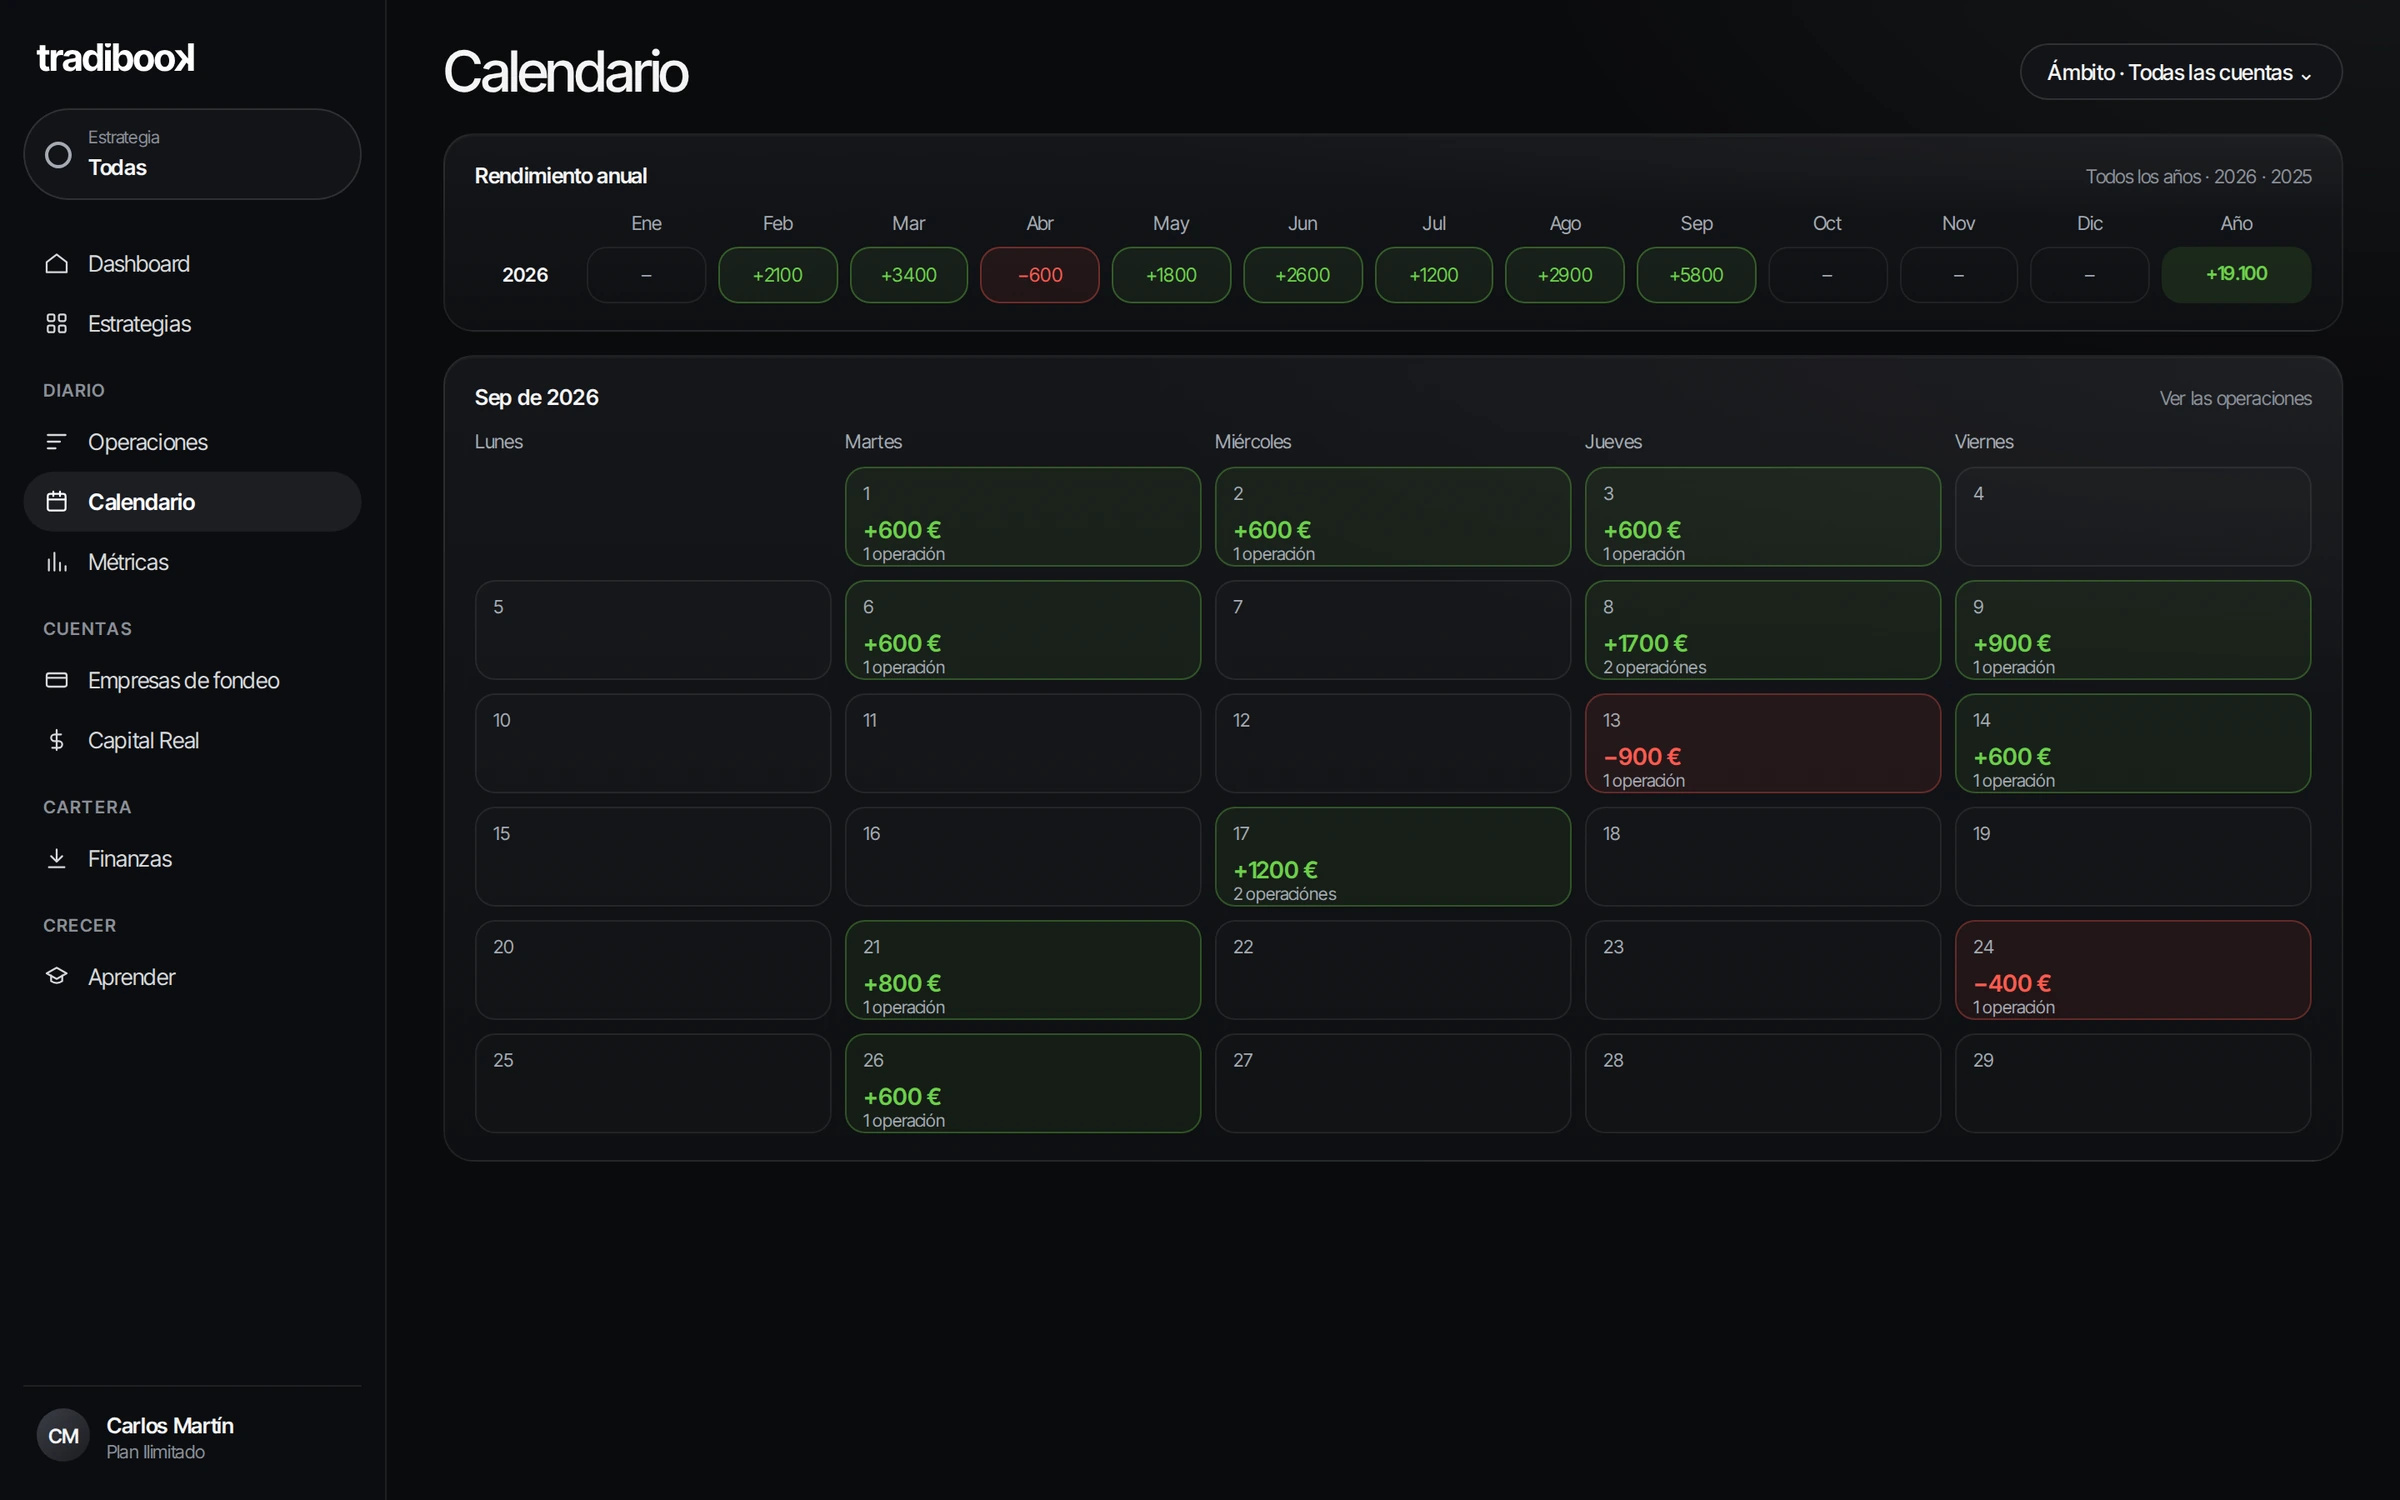
Calendar: green days and red days
Performance for each month and year, and when you pick a month, each day with its result. Below, the account balance for the period. It's the fastest way to spot streaks and days you'd better not trade.
Analytics: the numbers that change something
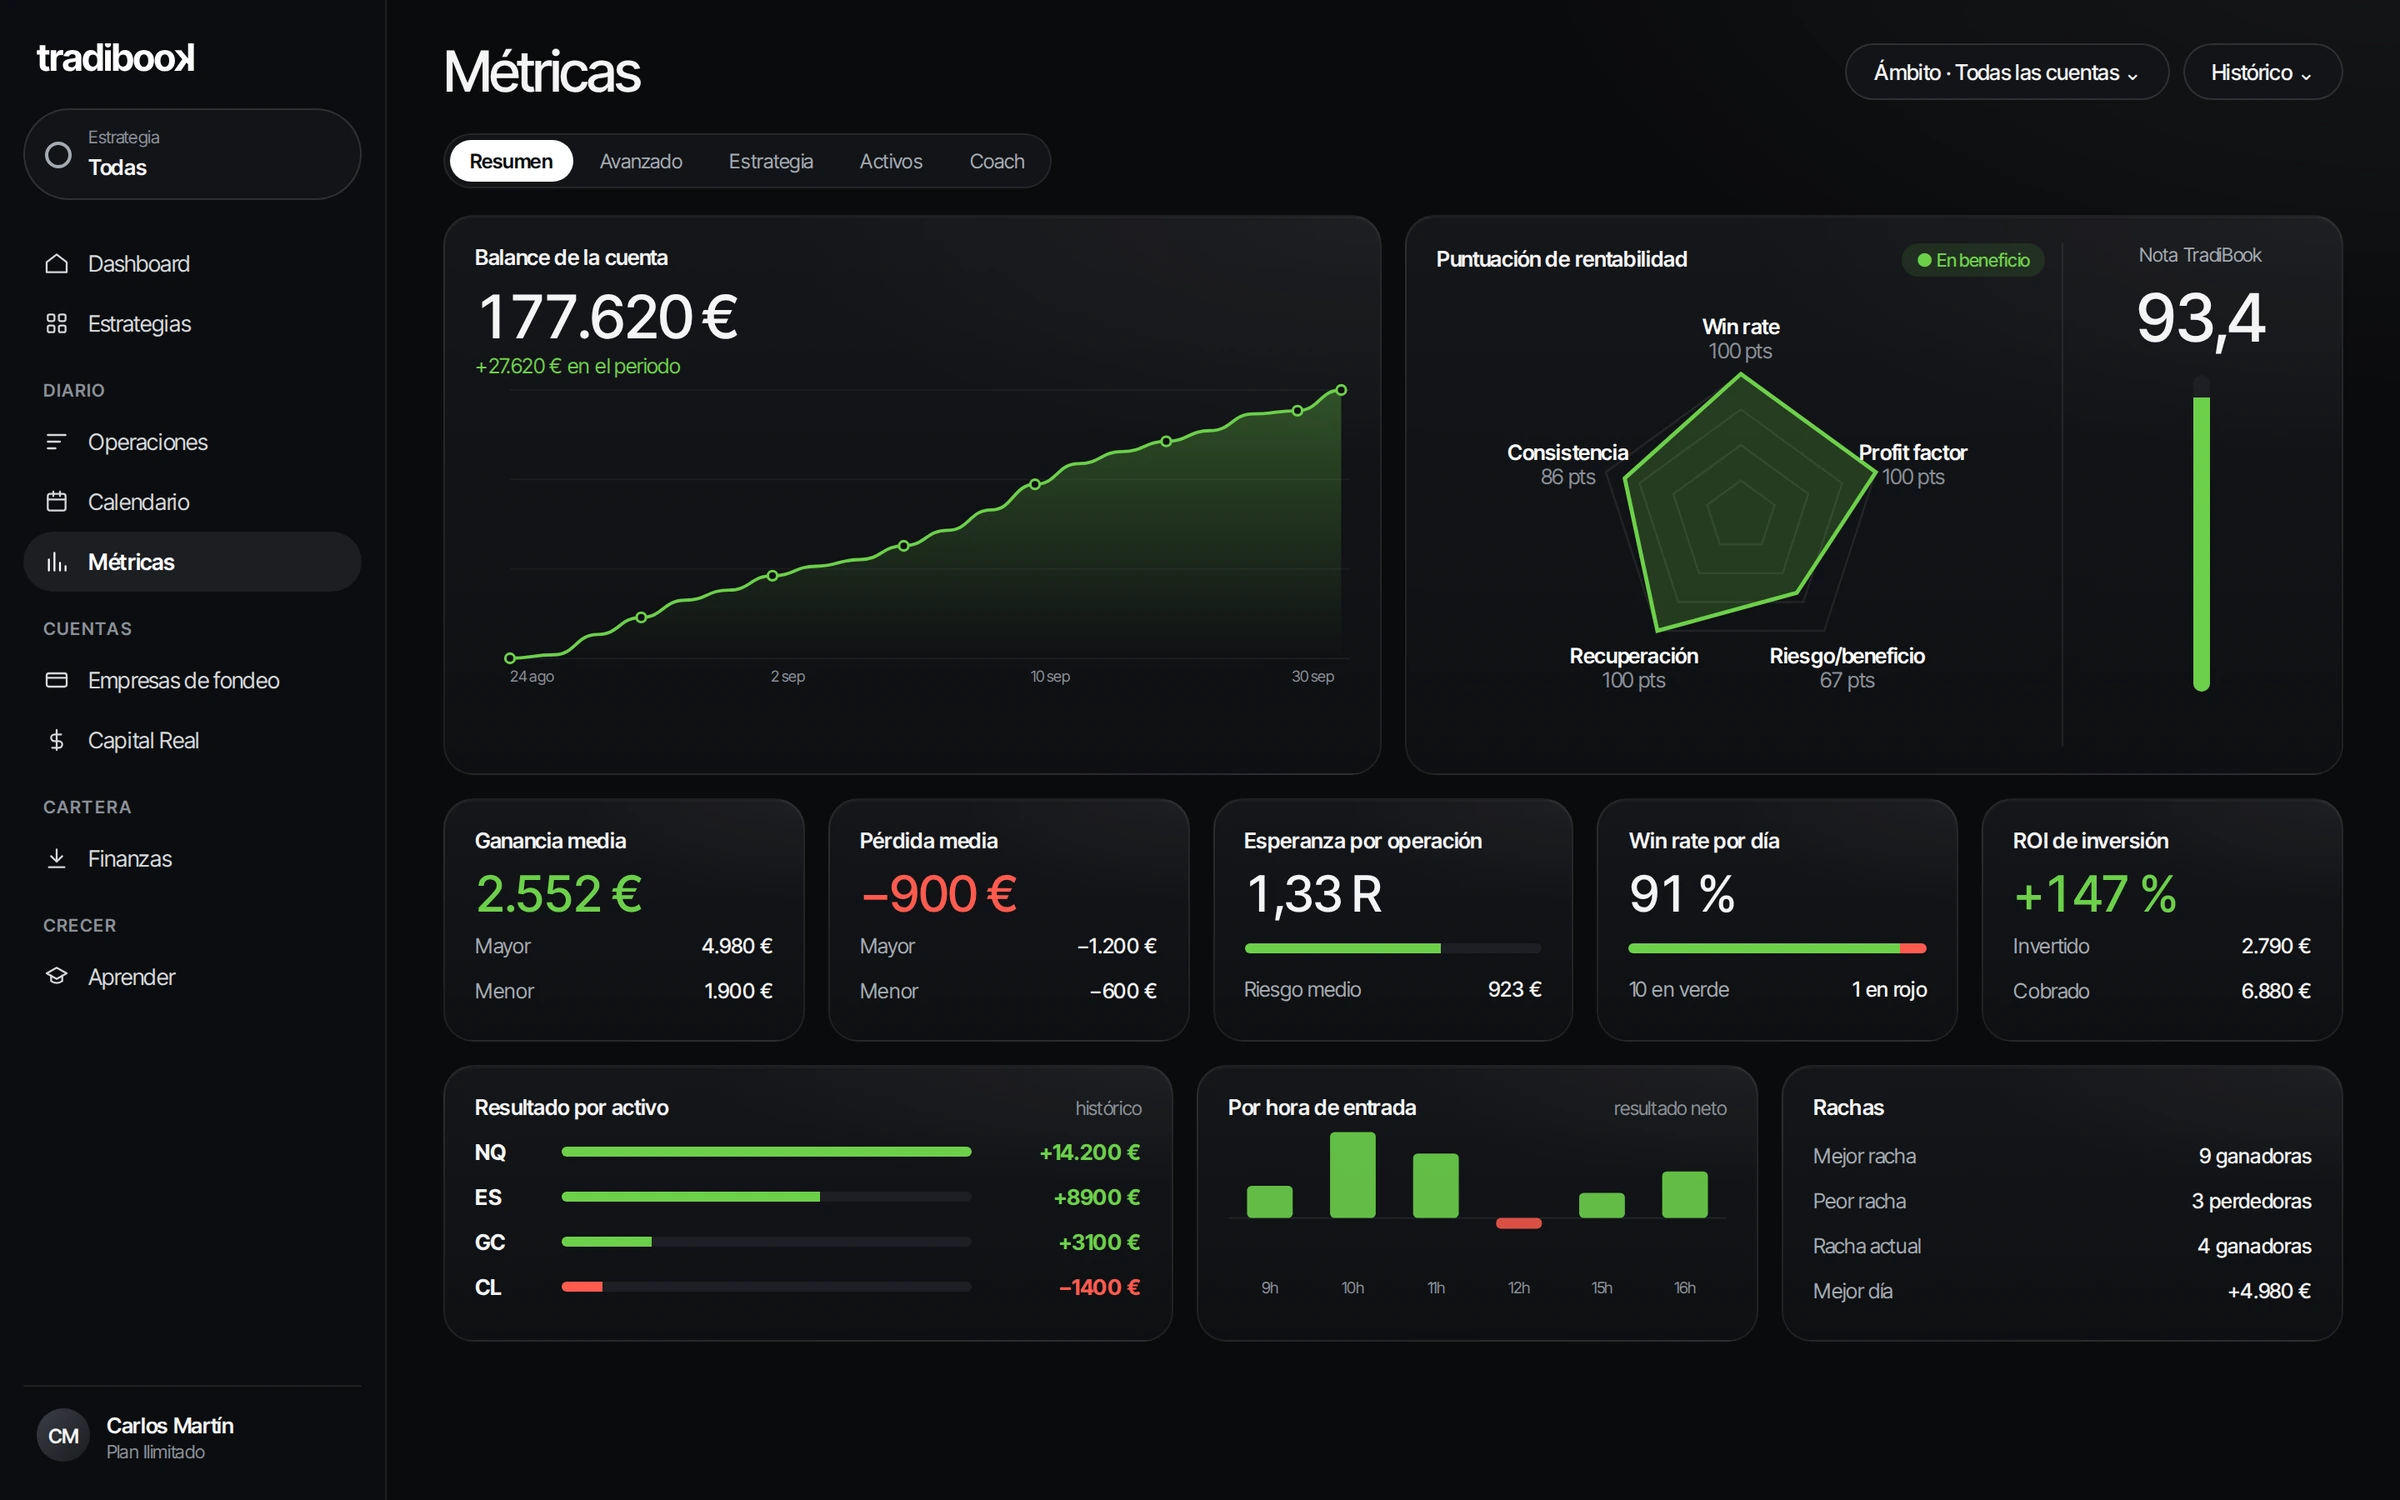
The profitability score combines win rate, profit factor, consistency, recovery and risk/reward into one grade. You also get average win and loss, expectancy per trade in R, win rate by day and by trade, and tabs to drill down by strategy and by symbol.
Funded accounts and challenges
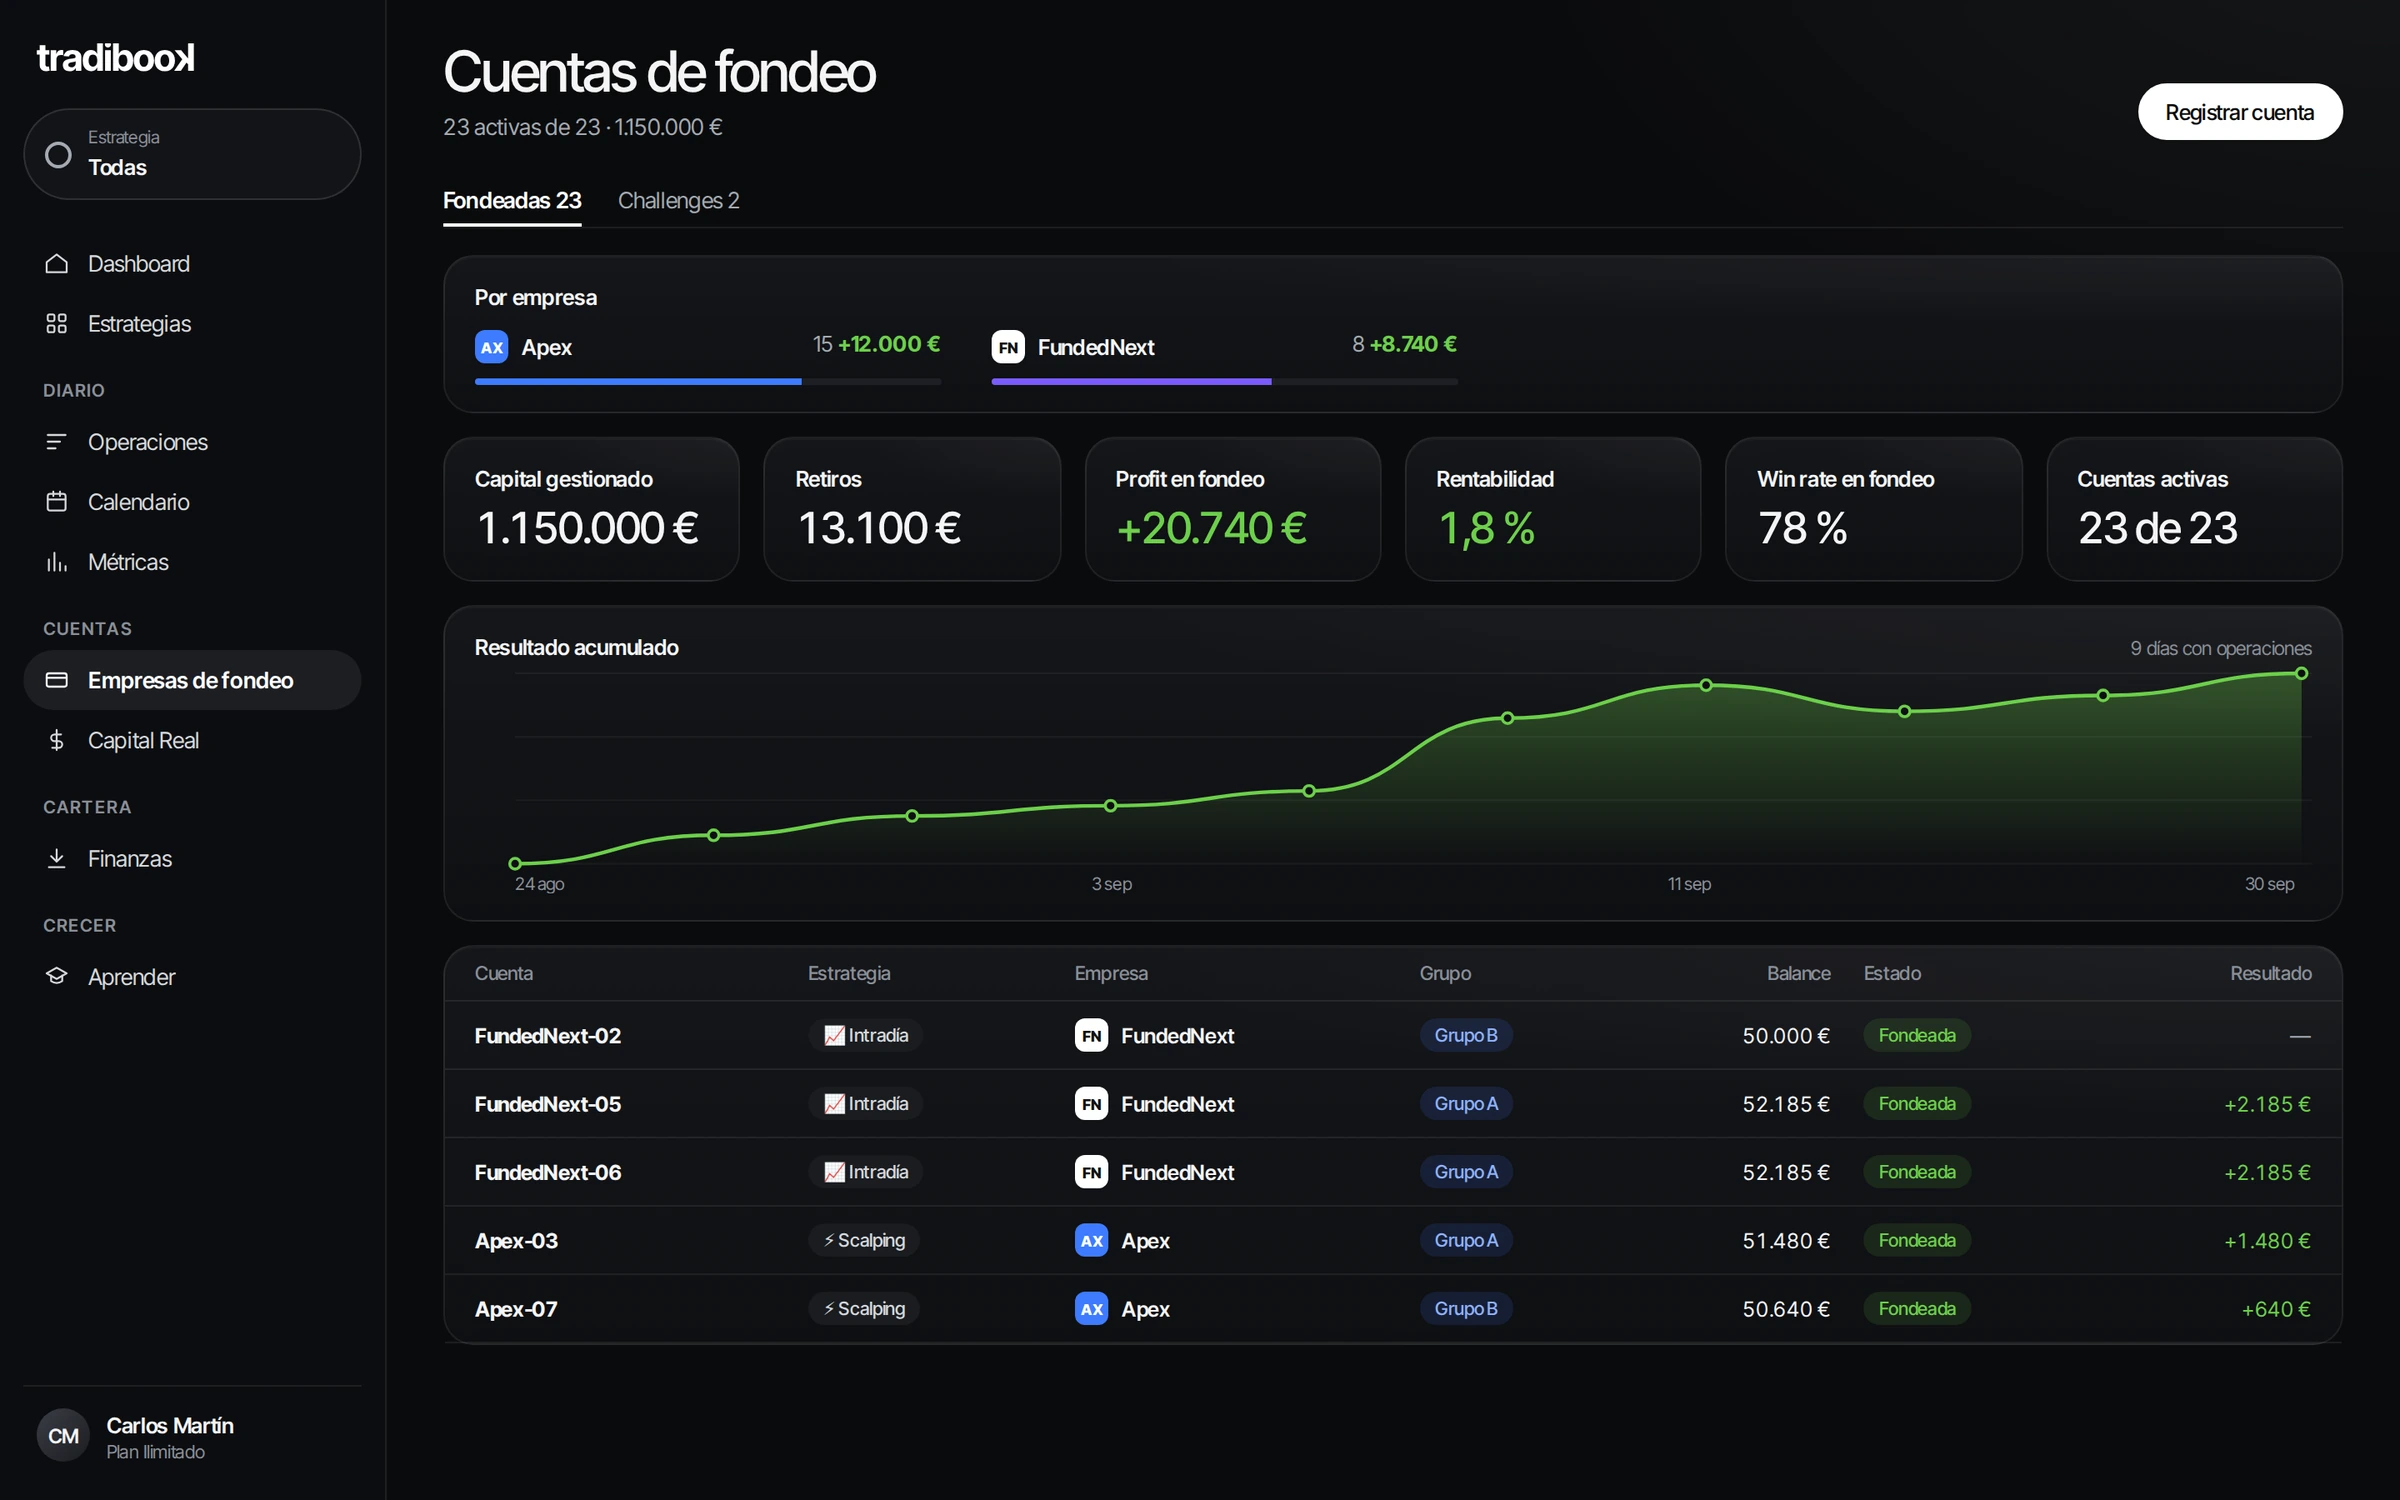
All your accounts, split into funded and challenges, with capital managed, profit, return and status for each one. You can organize them into risk management groups to see how each group performs, and decide whether challenges count in your analytics.
Live capital
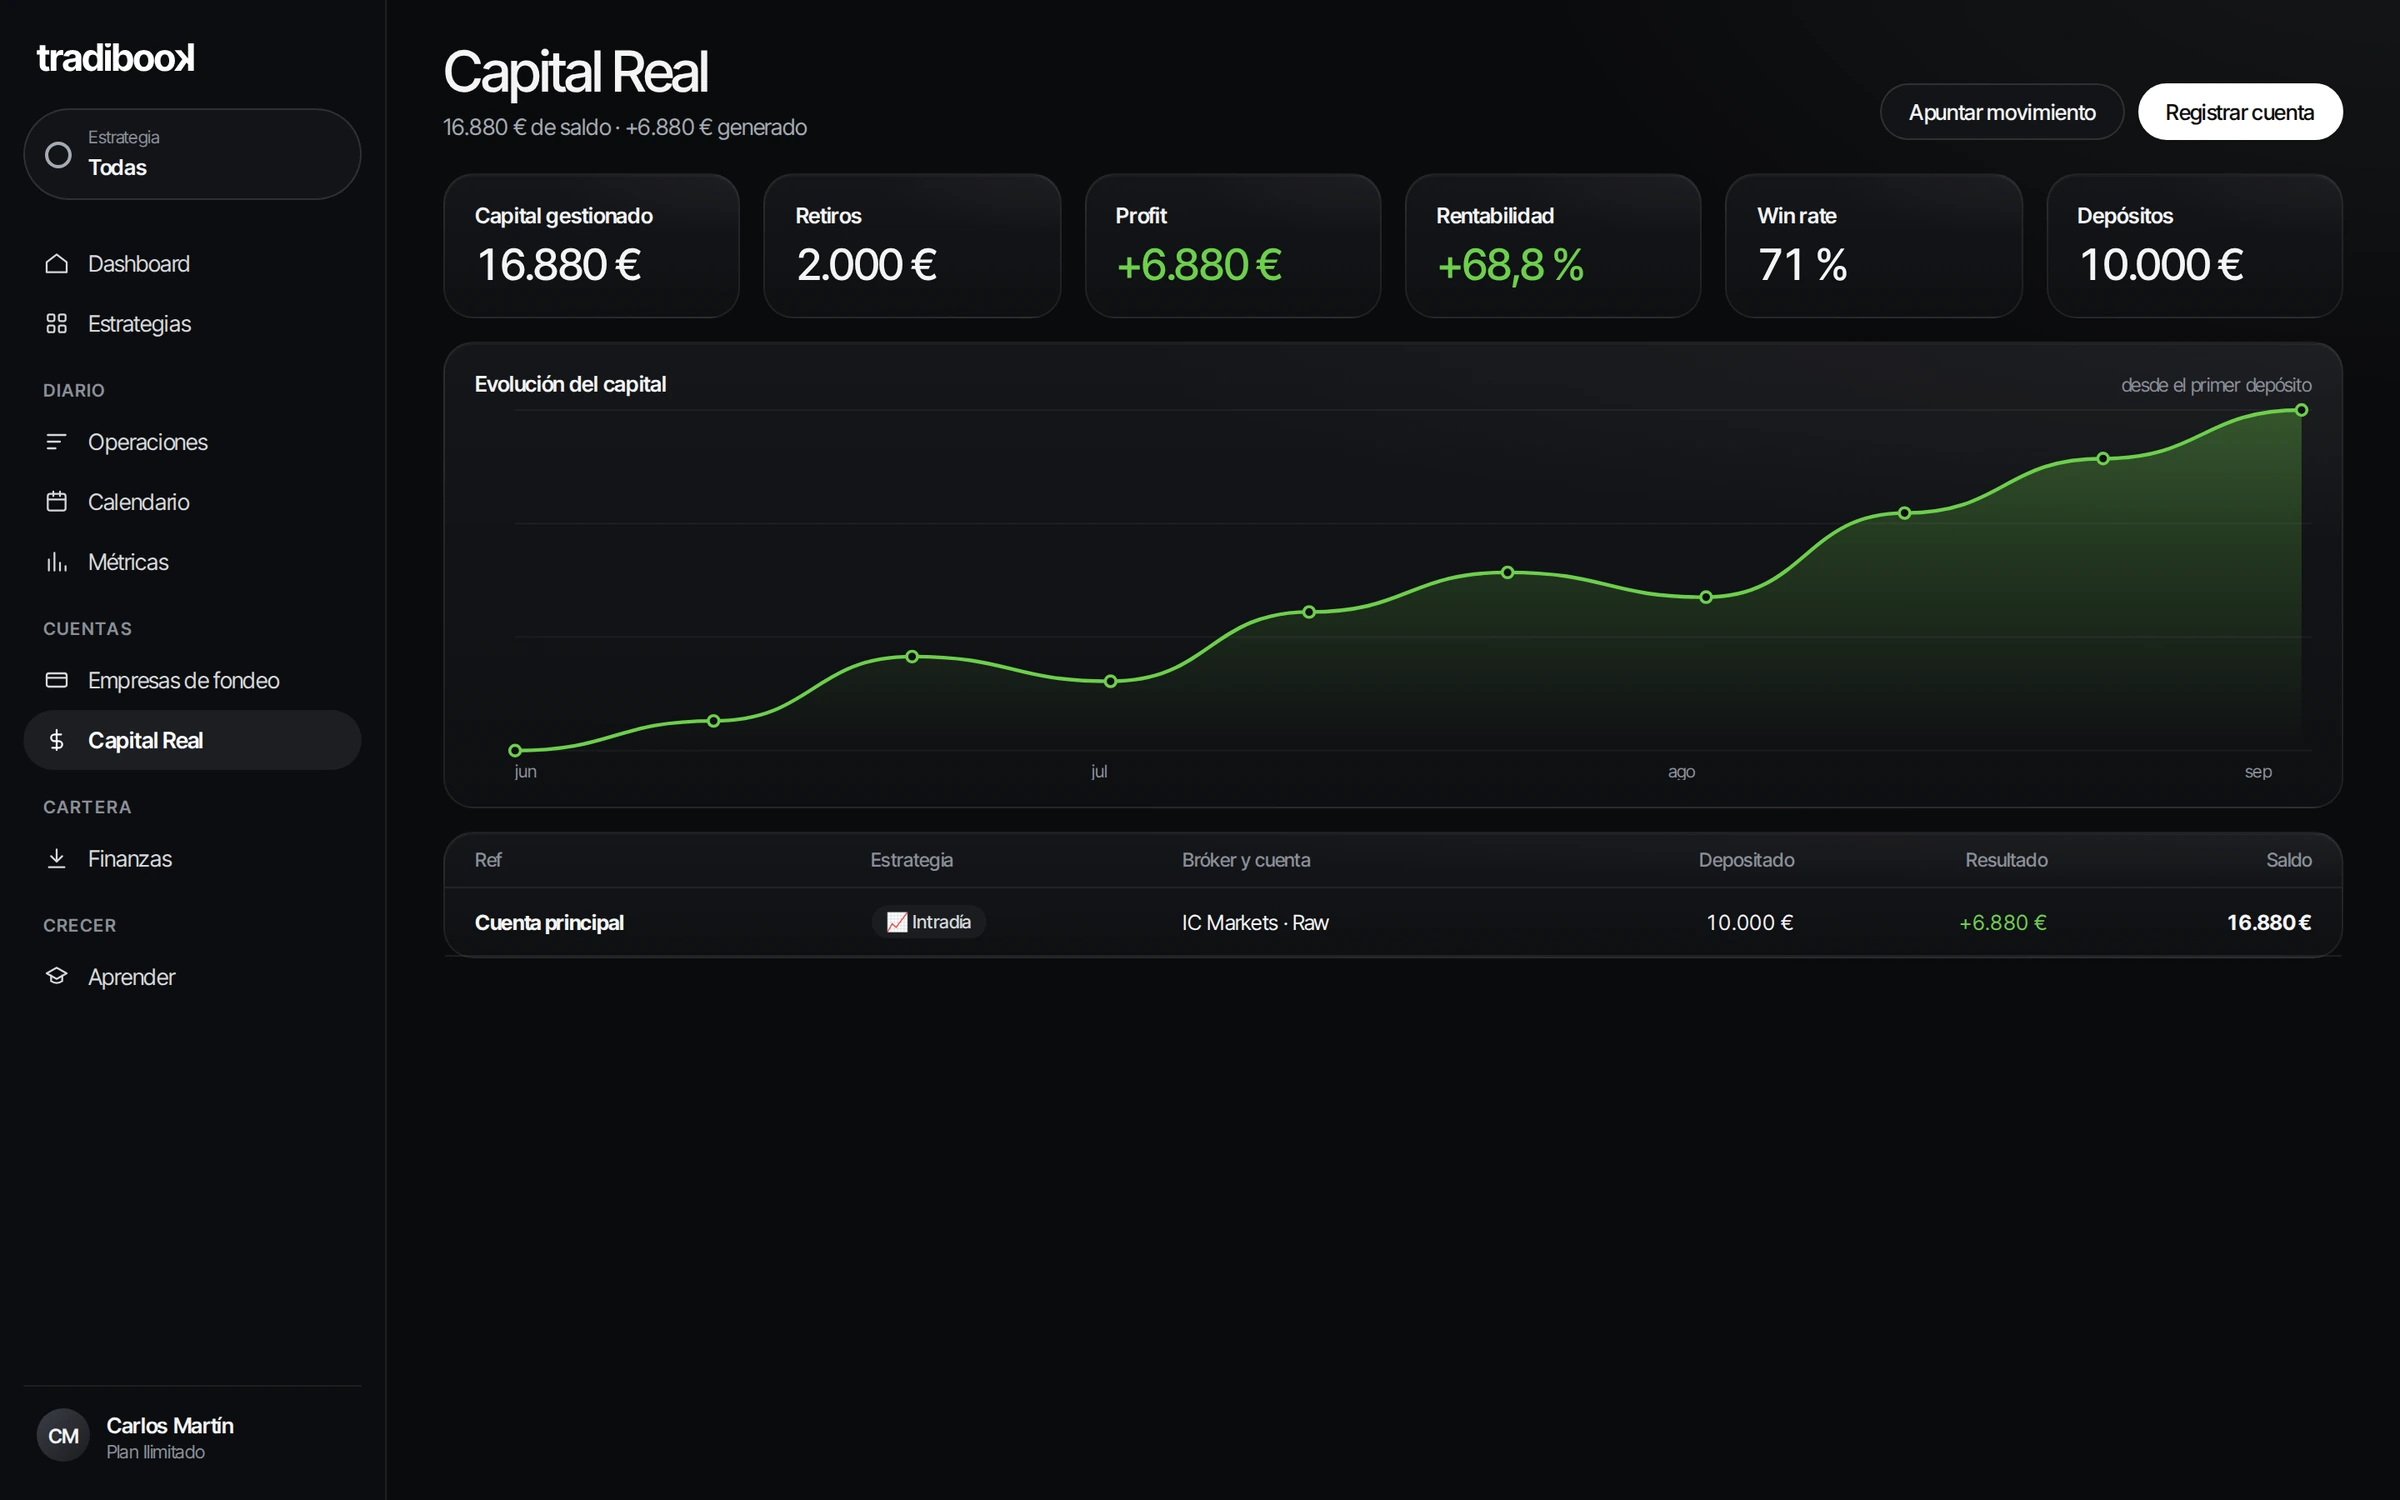
If you also trade your own money, it's kept separate: deposits, withdrawals, balance and capital growth, never mixed with funded accounts.
Finances: what comes in, what goes out and what's left
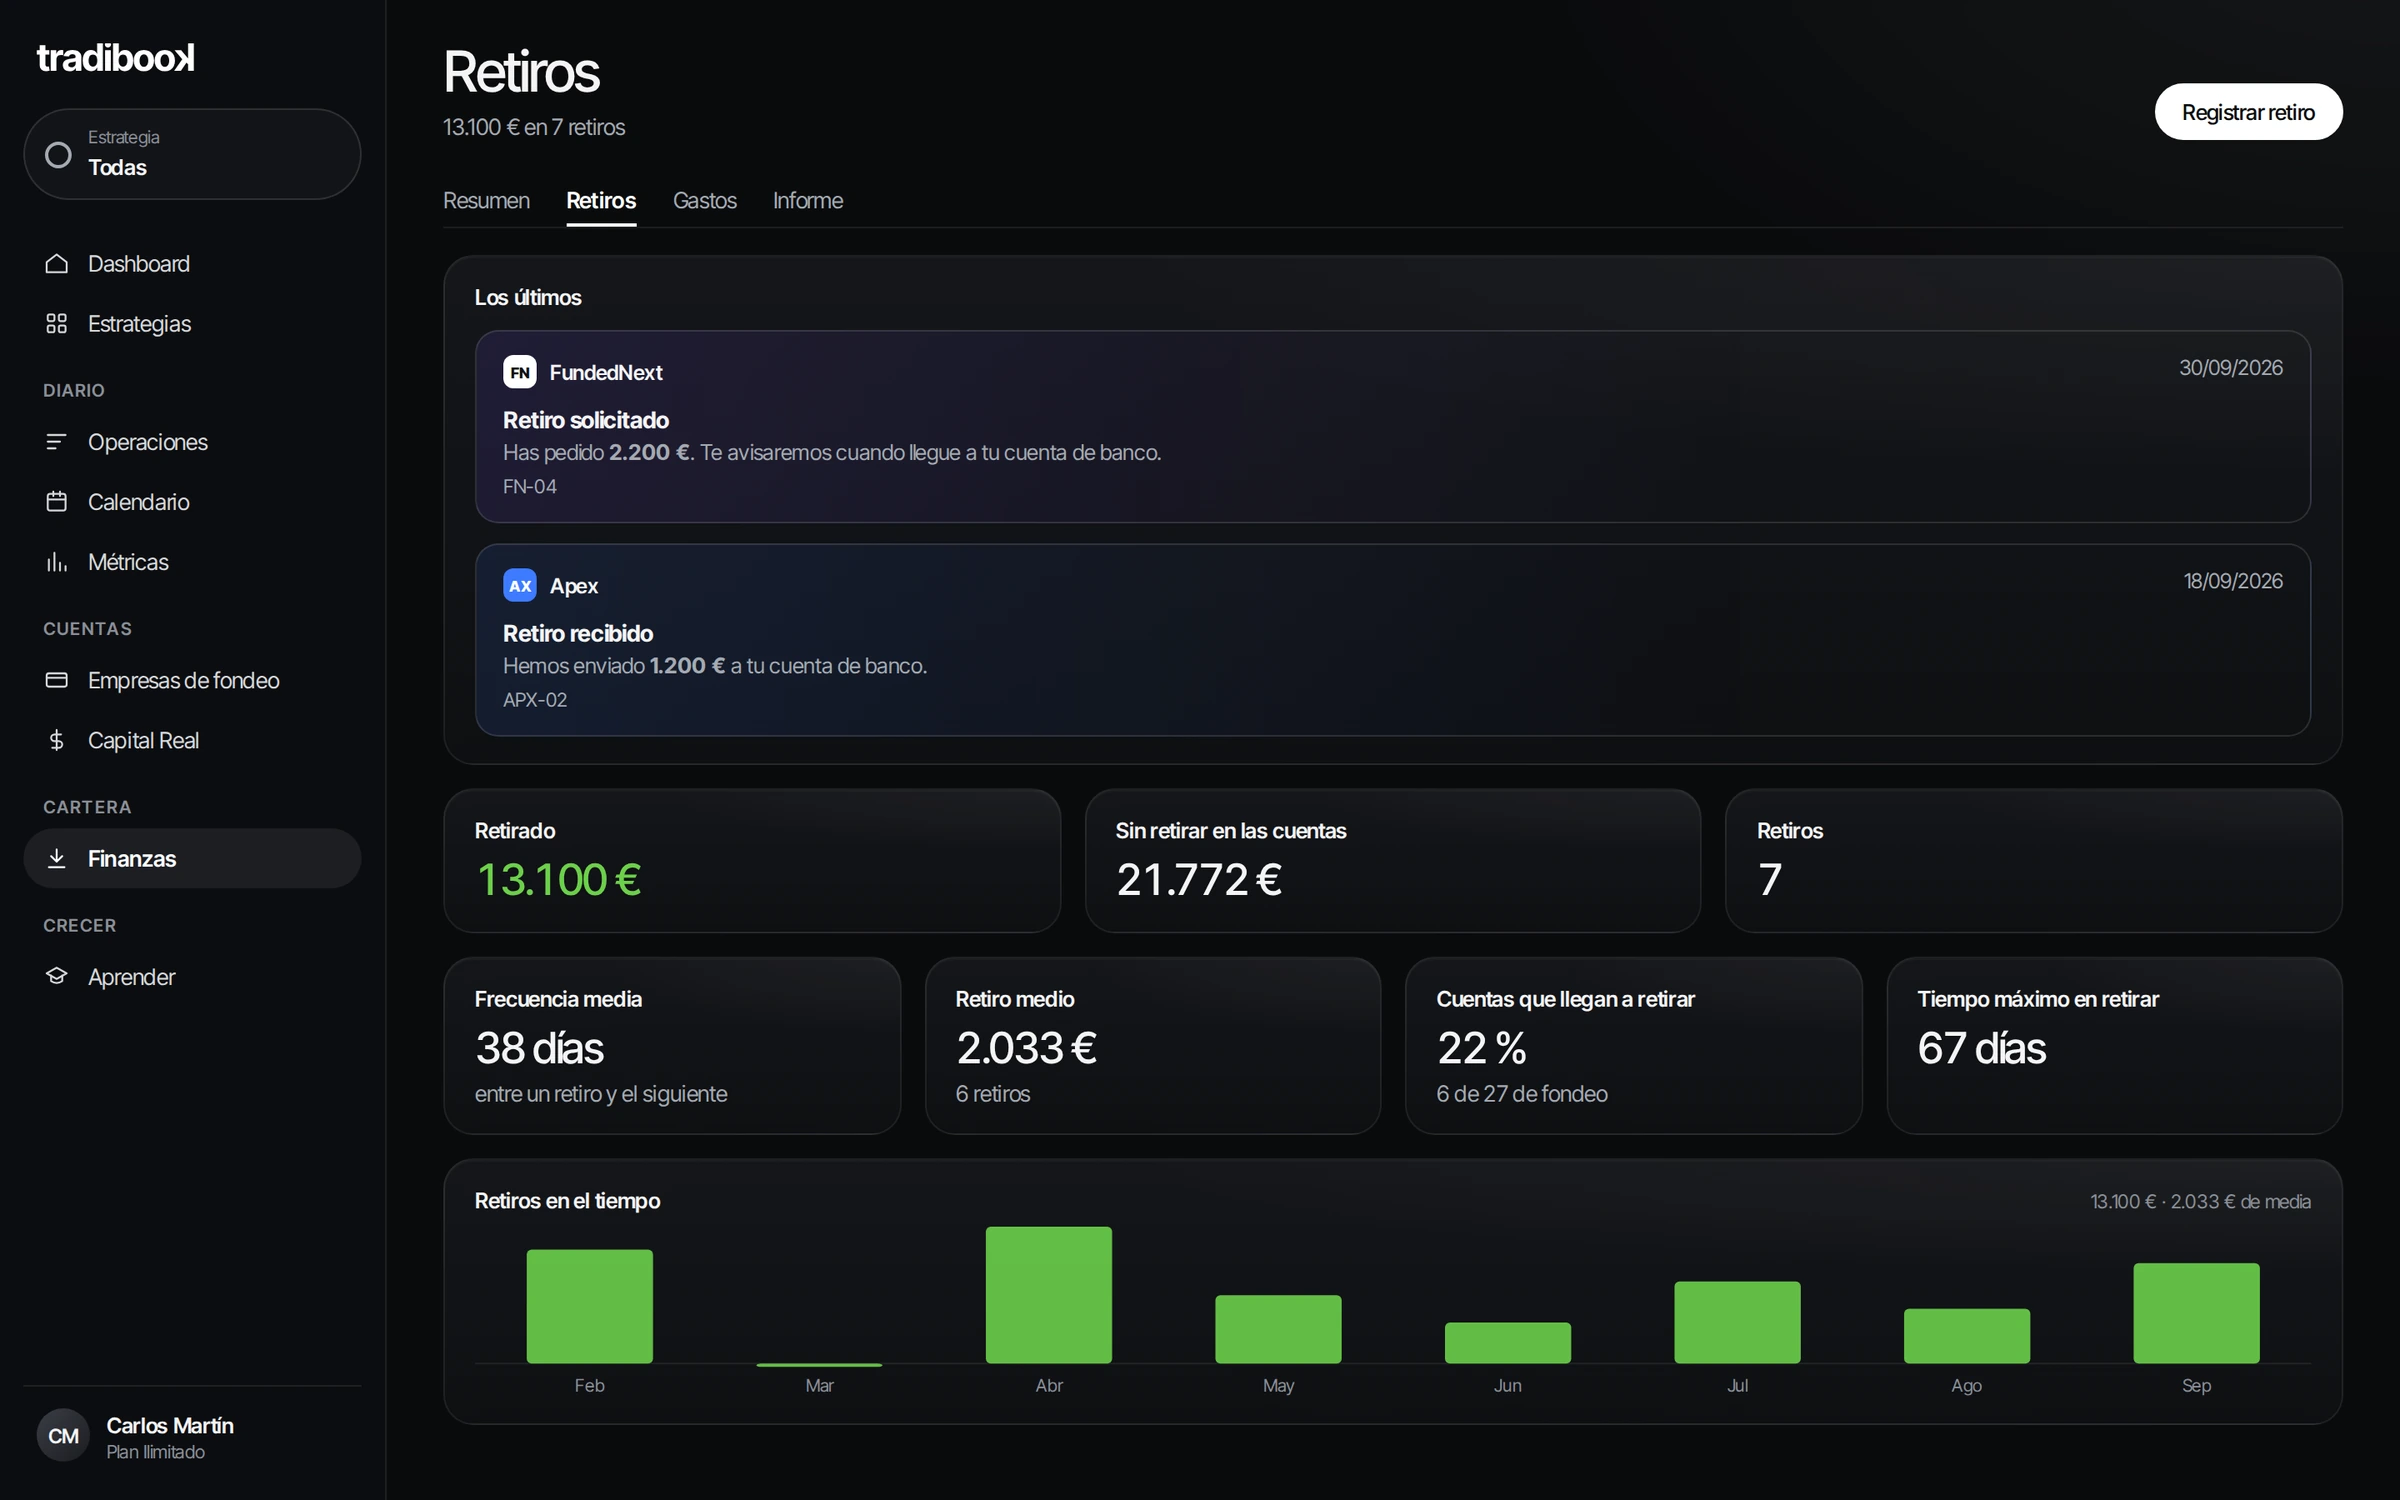
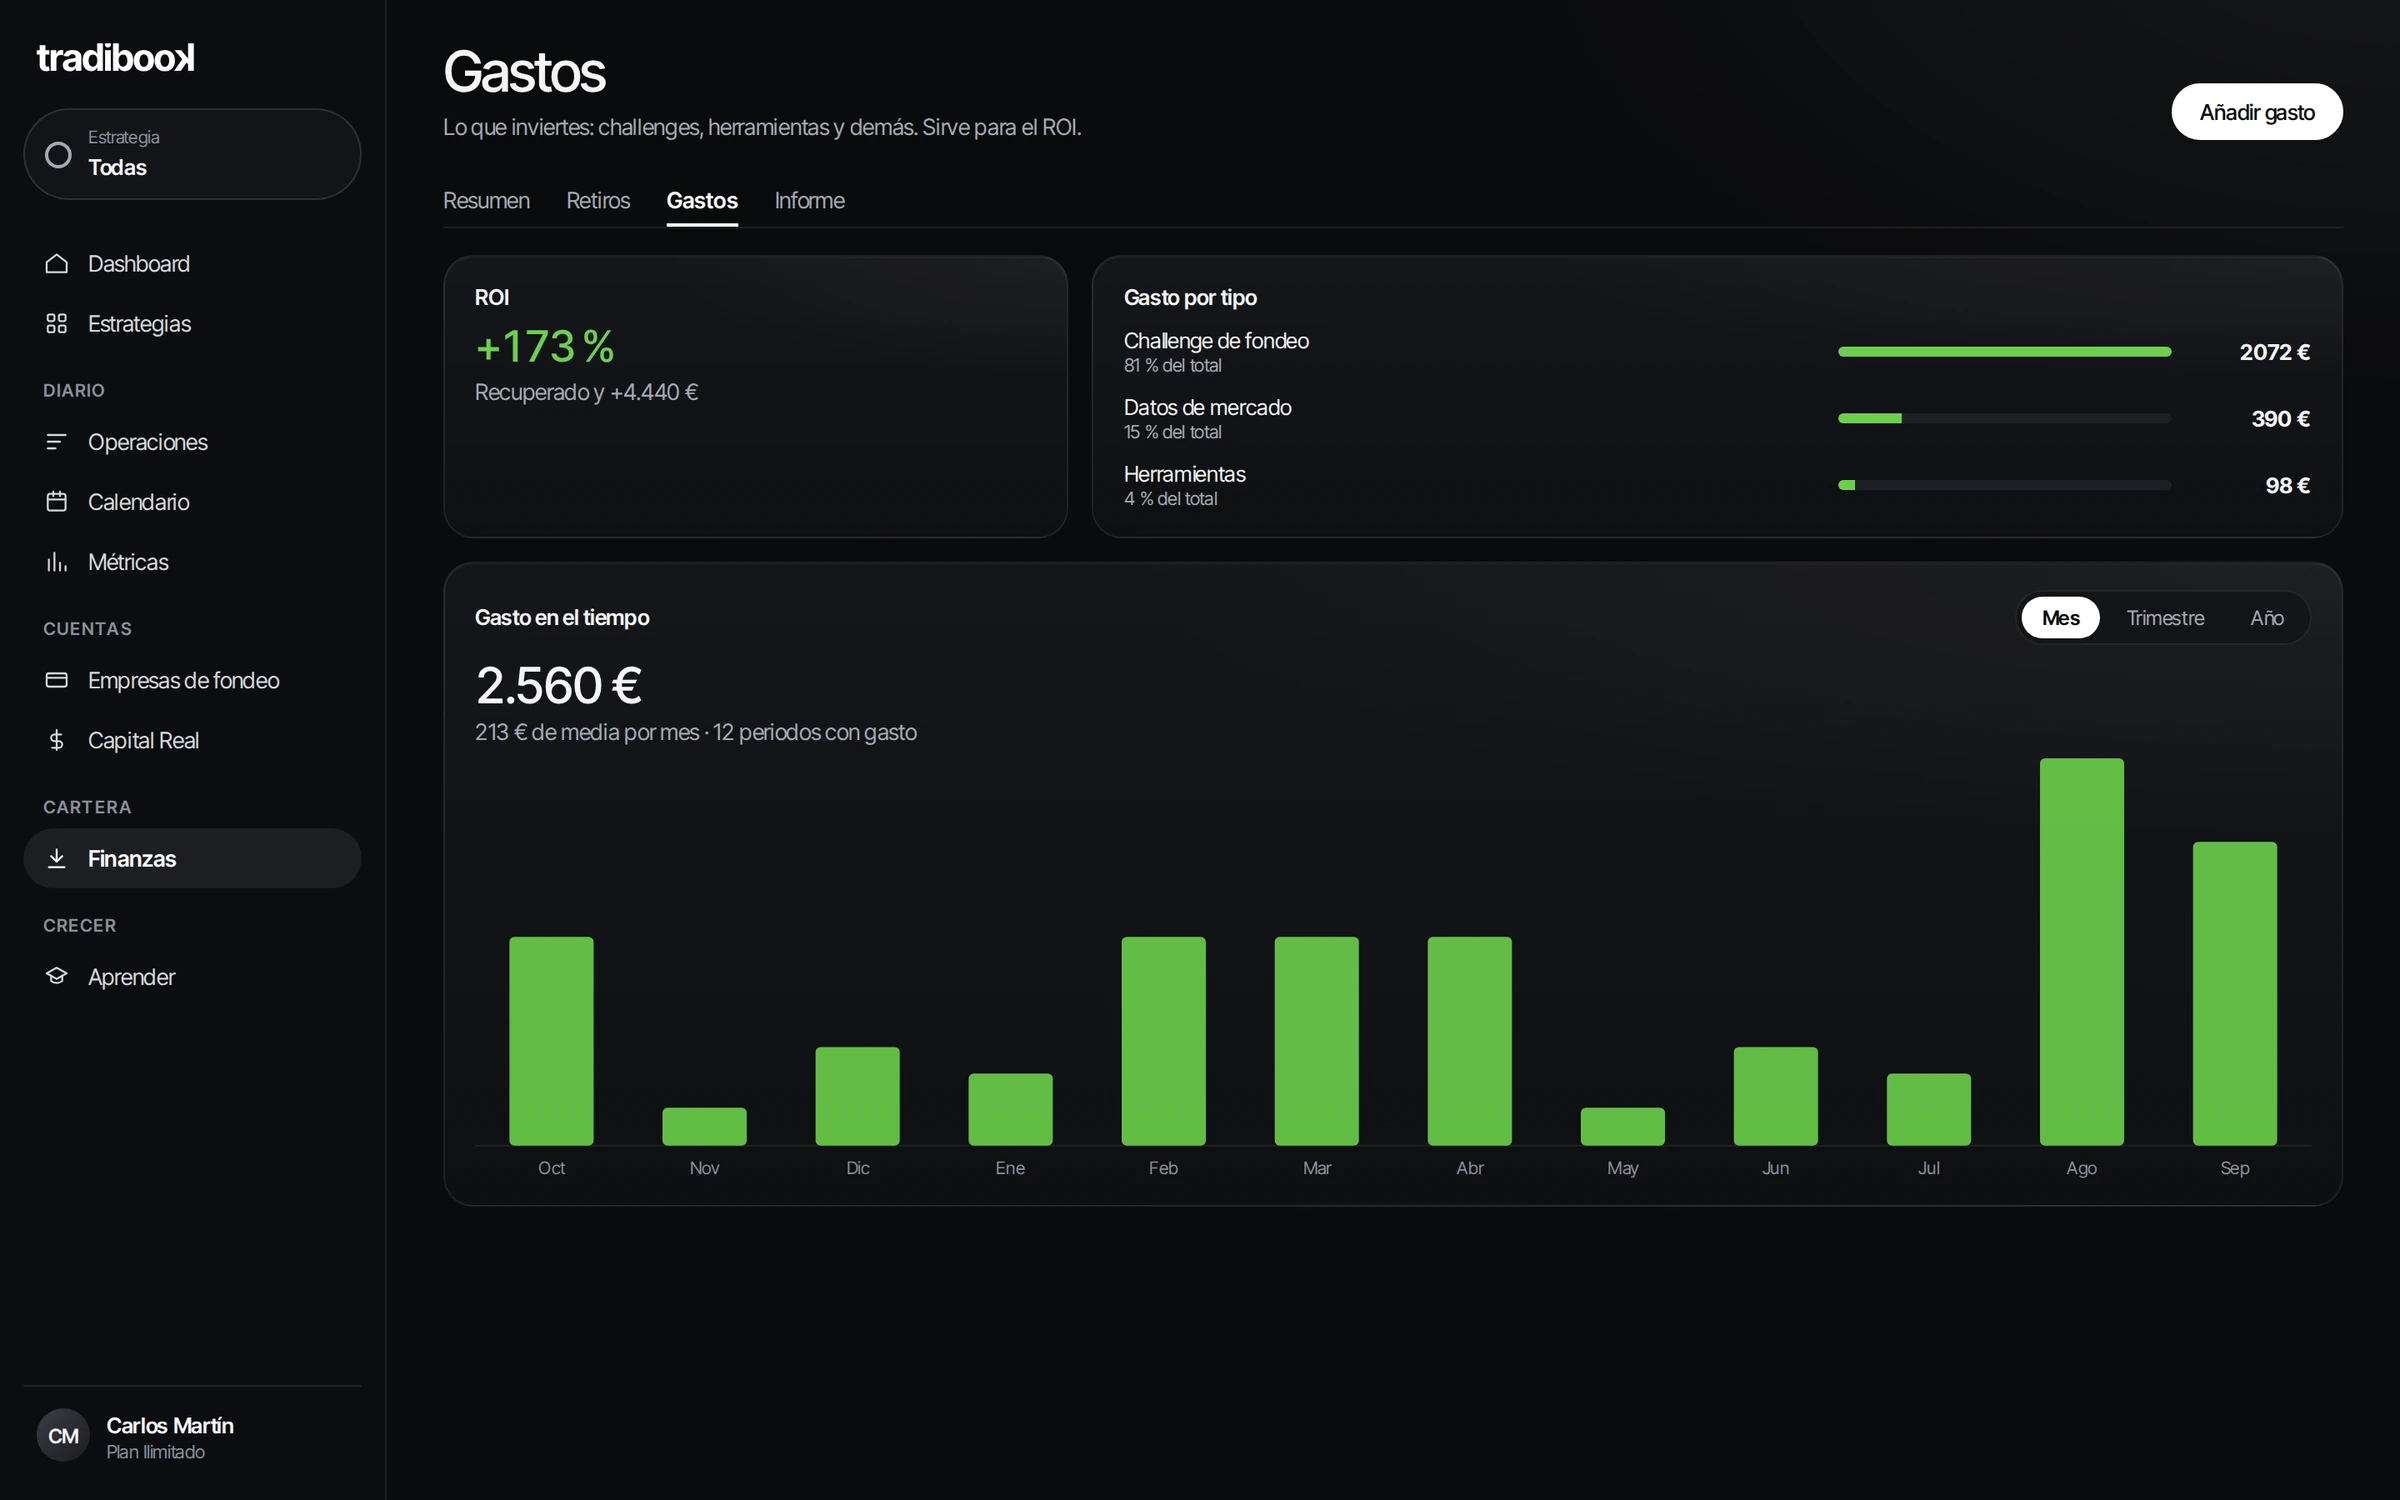
This is the part almost nobody measures. How much you've been paid, how much trading has cost you (challenges, market data, tools) and your real ROI. With payouts by firm, how often you get paid and the probability that an account reaches a payout.
Report for your accountant
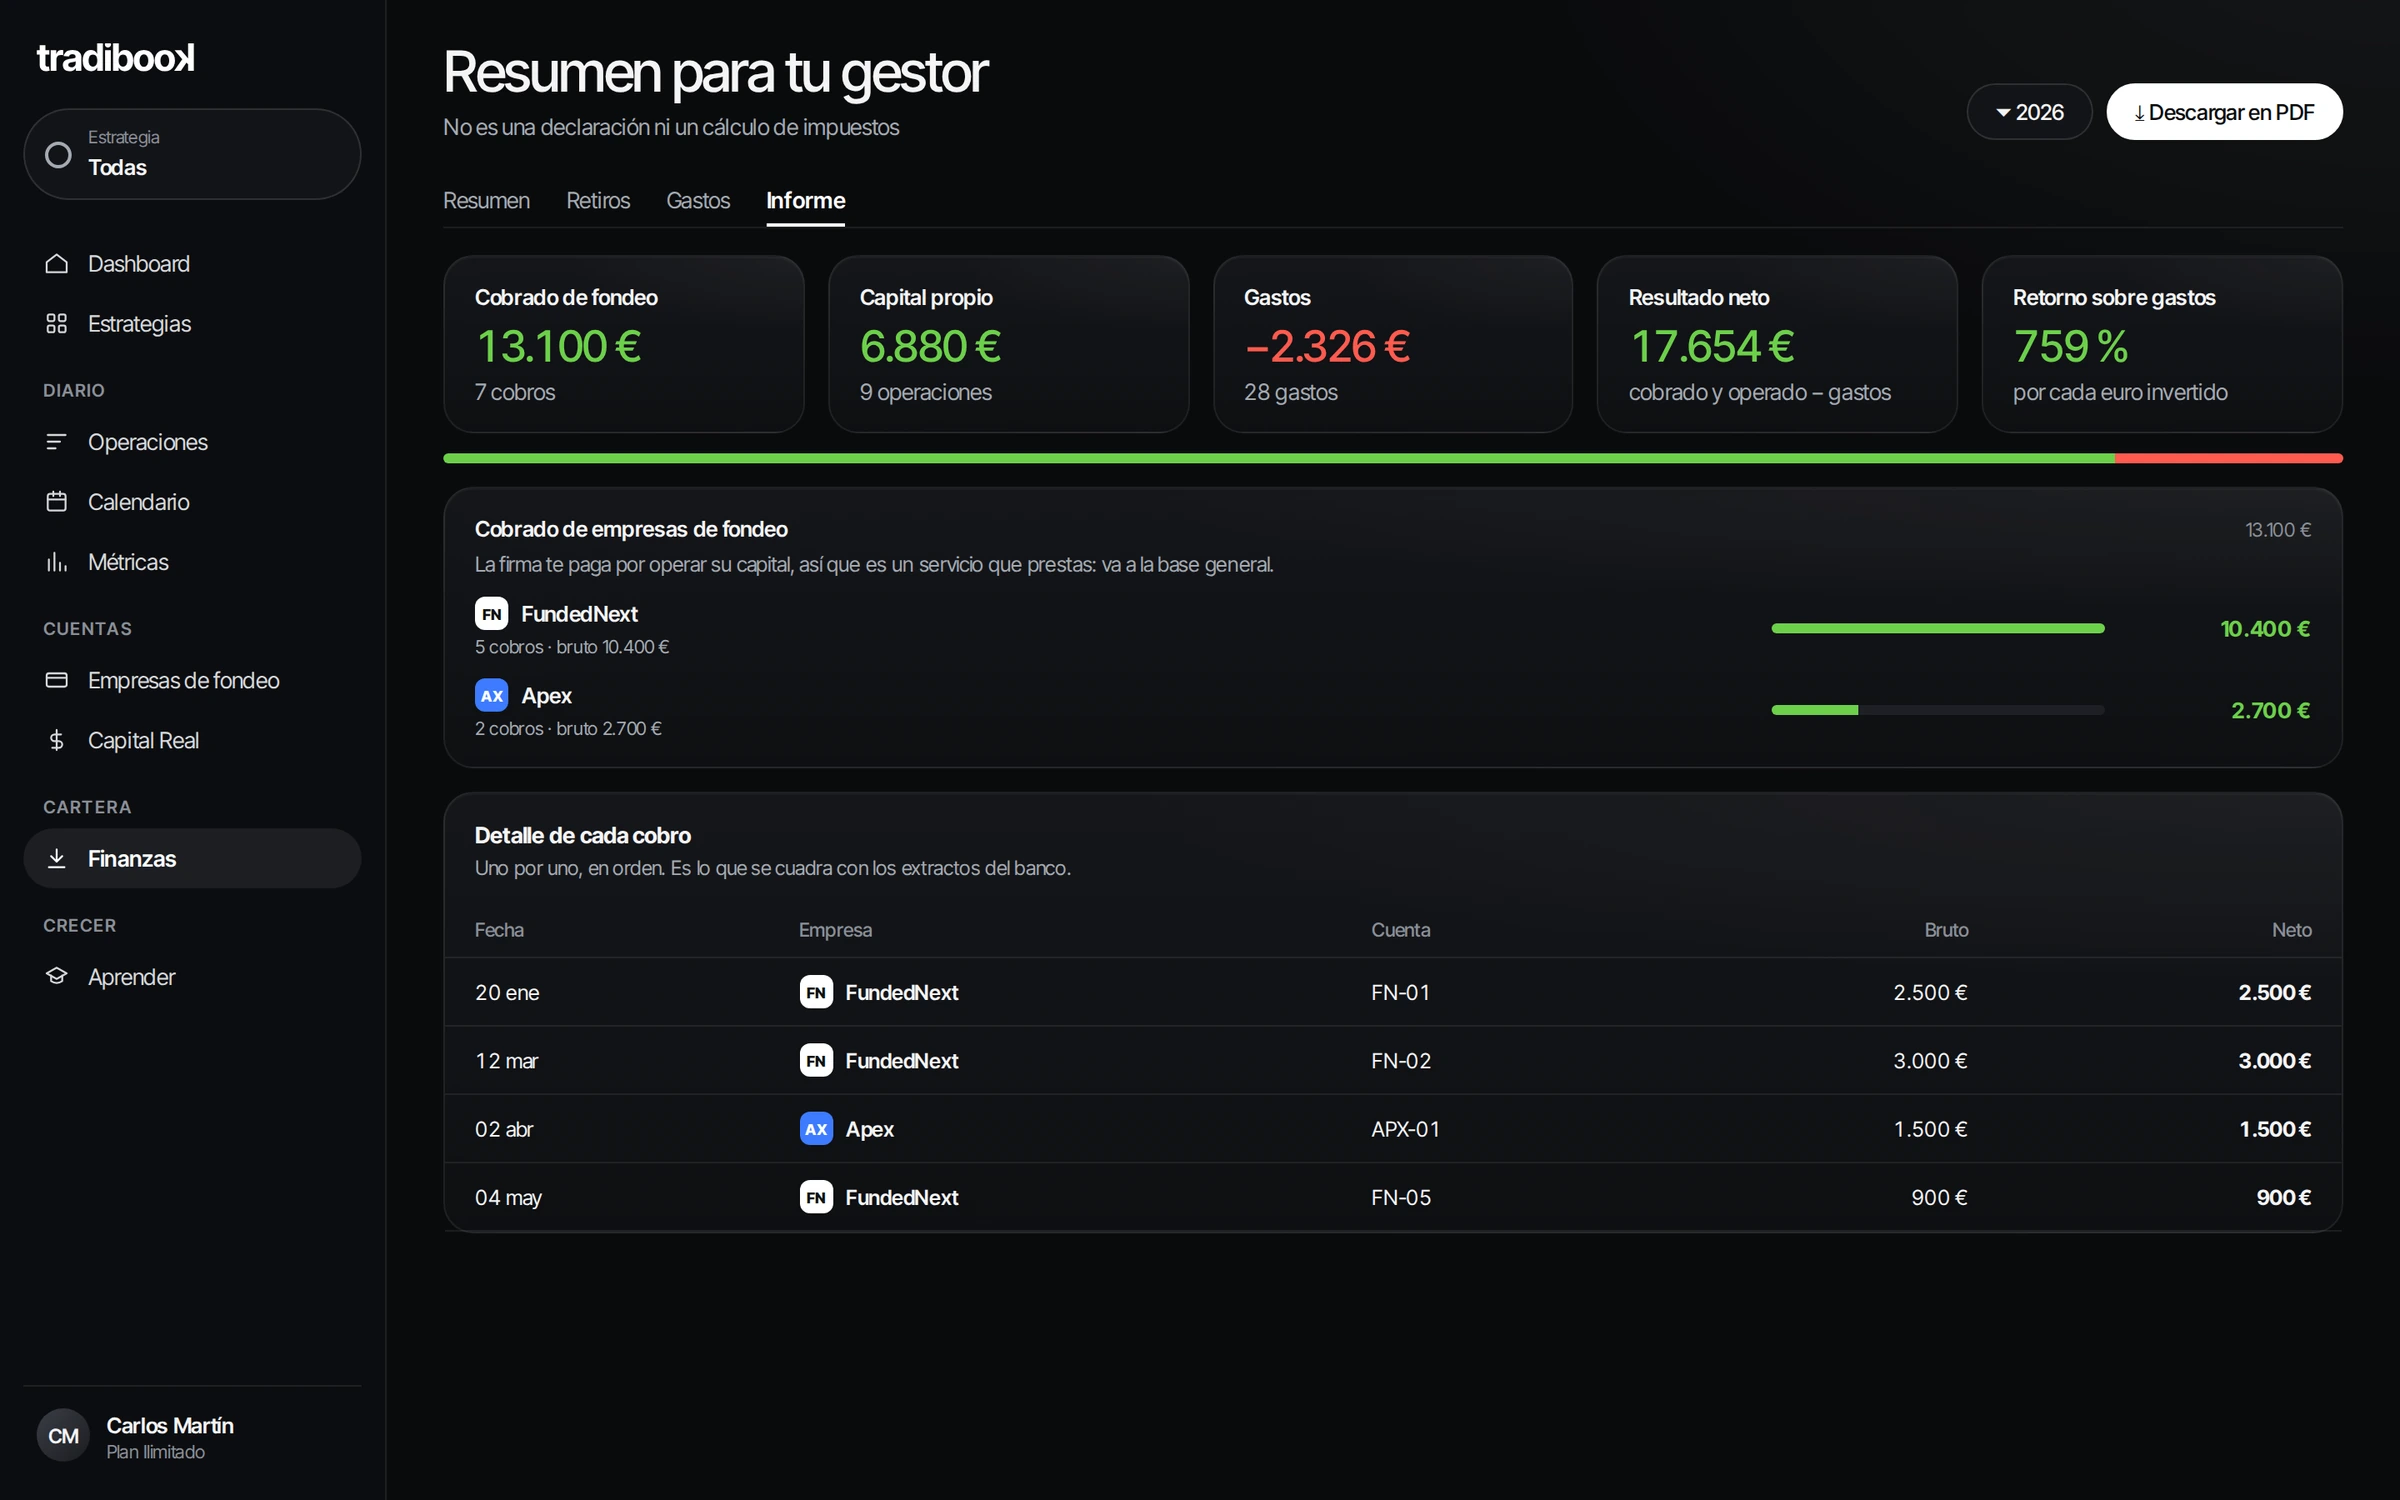
Everything received, expenses and net result for the year, payment by payment and ready to download as a PDF to hand to whoever does your books. It's not a tax return, but it saves them the work of putting it together.
In short
TradiBook isn't a colorful spreadsheet: it's your trading, your funded accounts and your money in one place, built for people who buy accounts, trade them and want to know if they're really making money. Try it on the free plan, no card required.
What makes TradiBook different
Every journal imports trades and shows a win rate. Not this.
Apex, Topstep, FundedNext, Tradeify… each account with its firm's logo and color, not a list of grey text. You recognize the account at a glance.
Card styles, light and dark theme, wallpapers and figures in money or percentage. One tap to change and it stays that way.
Minimal and polished: no twenty-tab menus or endless tables. Works just as well on your phone as on your computer.
Almost every journal is built by a software team. This one is run by a trader who also coaches other traders every day.

Funded account trader and trading coach: he reviews other traders' trading and helps them stop blowing accounts. That's where TradiBook came from. He didn't build it to sell a product: he built it because he needed to track his own accounts and no tool measured what mattered to him. Building it for his case, it ended up fitting anyone who trades funded accounts, because the problems are the same: the floor that moves, the accounts lost along the way and the plan that isn't followed.
Plan adherence, no-trade days and what you repeat most, measured automatically. Free plan, no card.
Get free access now